
Canada Gazette, Part I, Volume 148, Number 23: Multi-sector Air Pollutants Regulations
June 7, 2014
Statutory authority
Canadian Environmental Protection Act, 1999
Sponsoring departments
Department of the Environment and Department of Health
REGULATORY IMPACT ANALYSIS STATEMENT
(This statement is not part of the Regulations.)
Executive summary
Issues: Air pollutants negatively affect human health, place a serious burden on the health care system, degrade the environment and have an adverse impact on the economy. While progress has been made in reducing some air pollutant emissions, air quality remains an ongoing issue in Canada.
Actions to manage industrial emissions currently vary across Canada, creating an uneven playing field for Canadian enterprises. Canada lacks a nationally consistent approach to reducing industrial air pollutant emissions, and it is unlikely that a base level of performance standards can be established across Canada in the absence of federal action.
Description: The Multi-sector Air Pollutants Regulations (“proposed Regulations”) would impose mandatory national performance standards on specific sector/equipment groups, in order to establish a nationally consistent emissions “floor.” Within the proposed Regulations, performance standards for the cement sector and two equipment types (i.e. gaseous-fuel-fired non-utility boilers and heaters [“boilers and heaters”], and stationary spark-ignition gaseous-fuel-fired engines [“engines”]) are included. It is expected that requirements for additional sectors/equipment groups would come forward in the near future. The performance standards impose limits on the amount of nitrogen oxides (NOx) and sulphur dioxide (SO2) that can be emitted from cement manufacturing facilities, and limits the amount of NOx that can be emitted from the two equipment types.
Cost-benefit statement: The proposed Regulations are estimated to result in a reduction of approximately 2 065 kilotonnes (kt) of NOx and 96 kt of SO2 over the 2013–2035 period. A cost-benefit analysis was conducted for each sector/ equipment group, and each of these results in net benefits. The net present value of the proposed Regulations is estimated to be $6.5 billion for engines, $1.1 billion for boilers and heaters, and $1.4 billion for cement. The benefit-to-cost ratios are 15:1 for engines, 24:1 for boilers and heaters, and 34:1 for cement.
The present value of the benefits of the proposed Regulations is estimated to be $7.0 billion for engines, $1.2 billion for boilers and heaters, and $1.5 billion for cement. These benefits largely arise from avoided environmental and health impacts (such as premature mortalities and emergency room visits). These benefits occur across Canada, and the largest share of benefits is accrued in the province of Alberta.
The present value of the costs of the proposed Regulations is estimated to be $470 million for engines, $50 million for boilers and heaters, and $43 million for cement. These costs are largely due to the incremental expense of adopting the technologies required to reduce emissions. Due to the provision of flexible compliance options, and differing requirements for new versus existing capital, virtually all capital investments involve “add-on” technologies or the purchase of lower-emitting models at the time of natural capital stock turnover, rather than early retirement of capital stock. Costs are not expected to be directly passed on to consumers given the competitive positions of the affected sectors.
“One-for-One” Rule and small business lens: The proposed Regulations are expected to result in a net increase in administrative burden. However, these costs are small relative to other costs. The requirements associated with each performance standard in the proposed Regulations are estimated to result in an annualized increase in total administrative costs to all businesses subject to the proposed Regulations of approximately $120,075 for engines, $21,135 for boilers and heaters, and $1,237 for cement.
No small businesses would be affected by the performance standards for boilers and heaters or for cement. The small business lens analysis was applied to the performance standards for engines. The application of the small business lens analysis has resulted in an option in the proposed Regulations that decreases both compliance and administrative burden for small businesses by an estimated $19,025 over the period ($1,427 per business, or $68 per business annualized). An exemption for small businesses from the requirements for original engines is being proposed by Environment Canada.
Domestic and international coordination and cooperation: The Government of Canada has extensively engaged provinces and territories during the regulatory development process in order to better understand their perspectives on the proposed Regulations and the relationship with existing actions on the industries in their jurisdiction. Provinces support the implementation of the system, seeing it as a model of effective federal/provincial cooperation where each level of government takes distinct, coordinated actions within their authorities that are mutually reinforcing.
In terms of enforcement as well as monitoring and reporting requirements, efforts have been made to minimize overlap with existing provincial requirements. The federal government remains open to pursuing equivalency agreements with interested provinces.
The proposed Regulations would enable regulatory alignment with the United States under the Canada-United States Regulatory Cooperation Council Joint Action Plan, under which both Canada and the United States will be required to have regulatory approaches in place that address emissions of particulate matter and its precursor pollutants. The proposed Regulations are also important for continued engagement with the United States on transboundary flows of air pollution through the Canada-United States Air Quality Agreement.
The implementation of the proposed Regulations is not expected to affect trade.
Background
The Turning the Corner plan, published in 2007 for consultation, marked the first federal effort to enact mandatory requirements to address air pollution from industrial sources. It proposed an ambitious federal regulatory regime that reflected world-leading emissions standards for industrial sector emission sources. Provinces, industry and non-governmental organizations (NGOs) expressed concern with this approach, and proposed to develop an alternative approach that would consider regional air quality issues, balance federal and provincial regulatory roles, and impose less stringent federal standards on industry.
As a result, federal officials began working with stakeholders and provinces in 2008 to develop an alternative approach for managing air pollution. In October 2012, the federal/provincial/ territorial ministers of the Environment, with the exception of Quebec, agreed to implement the Air Quality Management System (AQMS). Quebec supports the general objectives of the AQMS and will collaborate with jurisdictions to implement the local and regional air quality management element.
The AQMS is a coherent approach to maintaining and improving air quality that was developed and endorsed by provinces and stakeholders. It includes three key elements: regional and local air quality management; updated, non-binding Canadian Ambient Air Quality Standards (CAAQS); and base-level industrial emission requirements (BLIERs) for major industrial emitters. The CAAQS are aspirational targets meant to drive the system. They provide the basis for provincial and territorial governments to determine what level of management action is needed. While the BLIERs implementation will set a minimum level of good performance nationally, provincial and territorial governments will monitor and manage their local sources of air pollution and take additional action on all sources in order to work towards achieving the CAAQS.
BLIERs were developed for both major industrial sectors and specific types of equipment. The AQMS sectors are aluminum and alumina, base metal smelting, cement, chemicals, electricity, iron ore pellets, iron and steel, oil sands, petroleum refineries, potash, pulp and paper, and oil and gas (defined here as upstream oil and gas and natural gas transmission pipelines). The equipment groups are gaseous-fuel fired non-utility boilers and heaters (referred to henceforth as “boilers and heaters”), non-utility combustion turbines, and stationary spark-ignition gaseous-fuel-fired engines (referred to henceforth as “engines”). When implemented, the BLIERs should ensure that all AQMS sectors in Canada, regardless of air quality where facilities are located, meet a good base level of environmental performance. While the BLIERs represent an emission “floor” for Canada, they are not designed to address poor air quality on their own; provinces and territories will assess sources of local air pollution and may require more stringent industrial emission standards for significant sources of air pollution.
Environment Canada intends to implement the BLIERs using a mix of regulatory and non-regulatory instruments, published over the next few years in phases. As part of the first phase, BLIERs that would be implemented via mandatory performance standards within the proposed Regulations are as follows:
- Engines, which are primarily used for compression, electric power generation and pumping in industrial facilities;
- Boilers and heaters, which generate steam for various purposes in industrial process applications (e.g. in situ extraction of bitumen in oil sands operations using steam-assisted gravity drainage); and
- Grey cement manufacturing facilities in Canada, of which there are 15 currently operating in Canada.
In subsequent phases, requirements for oil sands, petroleum refining, chemicals, fertilizers, upstream oil and gas, and volatile organic compound emissions from hydrocarbon sources may be proposed for addition to the proposed Regulations. Environment Canada is exploring different options for implementing a BLIER for coal-fired electricity in an effort to reach consensus for this critical sector. The timeline for this BLIER has not yet been determined.
Alternative instruments, such as pollution prevention (P2) notices, codes of practice, release guidelines, and performance agreements, are proposed to implement some BLIERs for the following sectors over the next two years: aluminum, iron and steel, oil sands, (see footnote 1) potash, pulp and paper, iron ore pellets, base metal smelters, and a code of practice to reduce emissions of particulate matter from the cement sector.
Issues
Protecting the health and environment of Canadians is a key government priority. Air quality is important to Canadians as air pollutant emissions negatively affect human health, place a burden on the health care system, degrade the environment and have an adverse impact on the economy. The federal government has the authority to address air pollution due to the identification of key air pollutants as toxic substances under the Canadian Environmental Protection Act, 1999 (CEPA 1999).
Industrial sources emit a large portion of all human-generated air pollutants in Canada. Emissions from industry, largely fossil fuel combustion, include sulphur dioxide (SO2) [89% of total 2010 emissions], nitrogen oxides (NOx) [39%], volatile organic compounds (VOC) [41%], primary fine particulate matter (PM2.5) [29%] and ammonia (NH3). These pollutants mix in the atmosphere and create two main components of smog: ground-level ozone, and secondary particulate matter.
While progress has been made in reducing some air pollutant emissions (e.g. regarding sulphur dioxide), air quality remains an ongoing issue in Canada. More than 35% of Canadians live in communities where the current Canada-wide air quality standard for ozone is not being met, and pollution levels will continue to be an issue as the population grows, the number of vehicles rises, pollution from international sources increases, and industry expands.
Numerous studies have linked particulate matter to cardiovascular and respiratory diseases or conditions, including heart disease, stroke, asthma, bronchitis, and emphysema. Similarly, ozone has been shown to exacerbate a wide range of respiratory conditions. In addition to their smog-forming potential, ambient levels of NOx and SO2 have also been linked directly to poor health effects. Exposure to any of these pollutants can increase the risk of medical complications, ranging from mild breathing difficulty, to severe chest pains, hospitalization, and even an increased risk of death. Vulnerable populations who are at elevated risk for these health problems include individuals with existing respiratory or cardiovascular problems, the elderly, and children due to their increased exposure levels. There is also growing evidence that air pollution may be associated with other health impacts (e.g. low birth weight and various neurological effects).
The negative health effects of air pollutants occur at all concentrations, not only at high concentrations (“smog days”). Even if there are only modest amounts of pollutants in the air, research shows that there are still health effects, especially among vulnerable populations such as children and seniors.
In addition to harming human health, air pollutants can cause a variety of negative impacts to vegetation, soils, water, wildlife, and materials, as well as overall ecosystem health. Plants are vulnerable to ozone: damage can be seen as flecks, blotches, and reddening on the leaves; growth can be stunted and some seedlings may not survive. Long-term exposure to ozone may result in crop yield losses, reduced timber growth, and premature livestock mortalities and illnesses. Acid rain containing harmful amounts of nitric and sulphuric acid damages trees and causes soils and water bodies to acidify, making the water unsuitable for some fish and other wildlife. Like humans, animals can experience similar health problems if exposed to air pollutants over time. In addition, the poor visibility associated with tiny particles in the air may negatively affect welfare, tourism and the enjoyment of outdoor recreational activities. Particulate deposition is also associated with soiling and structural damages.
In addition, air flow carries pollutants from province to province and between Canada and the United States. In turn, U.S. emissions are transported into Canada and contribute to the ambient levels of PM and ozone, which contributes to exceed the Canadian ambient air standards in some parts of the country. The lack of a clear national approach coupled with uncertain provincial actions have made it difficult for Canada to discuss improvements in cross-border pollution with the United States.
Table 1 below summarizes the significance of emissions sources in each sector/equipment group in relation to total industrial emissions, as well as their projected growth in emissions and geographical distribution in the absence of the proposed Regulations. The negative projected growth in NOx emissions for boilers and heaters is due to the expected natural replacement of old uncontrolled boilers and heaters with new equipment that is less emissions-intensive.
| Sector/ Equipment | Emissions in 2010 (see reference 1*) | Emissions as Percent of Total Canadian Industrial Sources | Projected Growth in Emissions by 2035 (in Absence of New Regulations) | Geographical Distribution |
|---|---|---|---|---|
| Engines | 489 kt NOx | 46% of industrial NOx emissions | 12% | Mainly located in British Columbia, and Alberta |
| Boilers and heaters | 26 kt NO (see reference 2*) | 2% of industrial NOx emissions | -7% | Mainly located in Alberta, British Columbia and Ontario |
| Cement | 28 kt NOx | 3% of industrial NOx emissions | 16% | British Columbia, Alberta, Ontario, Quebec and Nova Scotia |
| 19 kt SO2 | 2% of industrial SO2 emissions | 23% |
Reference 1*
The emission level for boilers and heaters is in 2011.
Reference 2*
The emission level for boilers and heaters is in 2011.
Objectives
The proposed Regulations are the vehicle through which the federal government intends to implement some of the BLIERs. This single regulation includes a section with content that applies to all or several sectors/types of equipment, along with separate sections with requirements specific to each sector/type of equipment. Therefore, these proposed Regulations would fulfil an important commitment of the federal government to implement the new AQMS, and contribute towards establishing a nationally consistent emissions “floor” across the country. In doing so, the proposed Regulations would lead to reduced air pollutant emissions (NOx and SO2), which will have positive health and environmental effects.
Specific objectives for each sector/equipment group are as follows:
- Engines: Limit the amount of NOx emitted from modern and original engines used by industrial facilities.
- Boilers and heaters: Limit the amount of NOx emitted from modern, original, and transitional boilers and heaters used by industrial facilities.
- Cement: Limit the amount of NOx and SO2 emitted from all grey cement manufacturing facilities.
Description
The proposed Regulations would impose mandatory performance standards specific to each sector/equipment group; they are described in turn below. In all cases, regulated facilities would be subject to enforcement and compliance requirements and penalties as specified under CEPA 1999.
Engines (equipment type)
The stationary engines burning gaseous fuels covered by the proposed Regulations are typically used for gas compression (such as maintaining well pressure or moving gas along pipelines), but can also be used for other purposes, such as back-up generators and pumping. They range in size from as small as the engine in a small car to as large as the engine found in a diesel-electric locomotive. They are a significant source of NOx emissions; in one hour of operation, an average sized engine emits as much NOx as an average light-duty vehicle does in almost 200 000 km.
The proposed Regulations would impose performance standards for both new (“modern”) and existing (“original”) engines, as set out in Table 2 below. Modern and original engines are defined based on when they are manufactured relative to January 1, 2015.
The proposed Regulations would require the submission of information to the Government. All engines in operation would be required to be registered, and information would have to be submitted identifying the regulated engines. For modern engines, the engine would be registered and the results of testing would be submitted annually starting one year after the engine begins to operate. For original engines, registration will be required as of January 1, 2018, and annual reports will be submitted as of 2021. For both modern and original engines, any time the engine's identifying information is changed, its registration will need to be updated at the same time as the subsequent annual report is submitted.
For modern engines, the U.S. Environmental Protection Agency's New Source Performance Standard for Stationary Spark Ignition Internal Combustion Engines was the basis for the proposed standard and size threshold. For original engines, the performance standard and size threshold was based on retrofit technologies that are currently available to operators and have been proven in operation. The size threshold for original engines is higher than that of modern engines in recognition of the challenges and costs of retrofitting smaller engines.
These performance standards are consistent with what can be achieved cost-effectively by installing emissions control technologies, including, but not limited to, non-selective catalytic reduction (NSCR); rich-to-lean-burn engine management systems; and pre-combustion chambers. Two options are available to meet the emission limits applying to original engines:
- Per unit approach: to meet the standard by modifying all applicable engines beginning in 2026, and by modifying engines representing at least half of the total power of all applicable engines between 2021 and 2026; or
- Average approach: to meet the standard by taking an annual average of emissions from all applicable engines; that is, some engines in a given collection will be able to emit below the performance standard while others will emit above, so long as the average annual emissions of engines in a collection meets the standard (referred to henceforth as the “fleet average approach”).
Criteria AQMS Sectors Covered |
Manufactured After January 1, 2015 (Modern Engines) Aluminum and alumina, base metal smelting, cement, chemicals, electricity, iron ore pellets, iron and steel, oil sands, petroleum refining, potash, pulp and paper, and oil and gas (defined here as upstream oil and gas and natural gas transmission pipelines) |
Manufactured Before January 1, 2015 (Original Engines) Oil and Gas |
|
|---|---|---|---|
| Regular-usage Engines | Size Threshold (kilowatts, kW) | ≥75 | ≥250 |
| NOx Emission Limits | 2.7 grams per kilowatt-hour (g/kWh) output or 160 parts per million by volume on a dry basis (ppmvd) at 15% oxygen | Flat Limit: 4 g/kWh output or 210 ppmvd at 15% oxygen (engines comprising 50% of total power as of 2021; 100% by 2026) or Fleet Average: 8 g/kWh output or 421 ppmvd at 15% oxygen as of 2021; 4 g/kWh or 210 ppmvd at 15% oxygen as of 2026 | |
| Testing | Baseline Performance Test; Ongoing Tests for Engines ≥375 kW in size | Baseline Performance Test; Ongoing Tests for Engines ≥375 kW in size | |
| Low-usage Engines | Size Threshold (kW) | ≥100 | None |
| NOx Emission Limits | 2.7 g/kWh output or 160 ppmvd at 15% oxygen | None | |
| Testing | None | None |
Original low-usage engines, which are those engines used less than 5% of the time in a three-year period, are not subject to the same emission requirements as regular-usage engines. Low-usage engines are expected to represent a small percentage of the total engine fleet. Given their low usage, these engines are not a significant source of NOx emissions and would be less cost-effective to retrofit than regular-usage engines. The proposed performance standards for original engines apply only to facilities in the oil and gas sector (non-oil sands upstream oil and gas, natural gas transmission pipelines).
Boilers and heaters (equipment type)
A boiler burns gaseous fossil fuels, such as natural gas, to create hot water or steam for use in industrial processes and heating, while a heater directly heats the material being processed. Boilers and heaters are typically comprised of a combustion chamber, burners, a pressure vessel (only for boilers), and control/ monitoring equipment. The burner design determines the NOx emissions; a well-designed burner can reduce NOx emissions by a factor of five, compared to a standard burner.
Boilers and heaters are found in most sectors of the Canadian economy. Using size thresholds that industry, provinces and NGOs agreed upon during discussions of the emission limits (as noted in Table 3 below), only boilers and heaters having a rated capacity greater than or equal to 10.5 gigajoules per hour (GJi/hr) would be subject to the proposed Regulations.
The proposed Regulations would impose performance standards for both new (“modern”) and existing (“original”) boilers and heaters, as set out in Table 3 below. The performance standards differ depending on whether the equipment is a boiler or a heater, whether the equipment burns natural gas or alternative gaseous fuels, whether the heater preheats the combustion air, or whether the boiler has an efficiency of more than 80%. For each consideration, except for efficiency, the emission limits were chosen so that the technical difficulty in meeting them is roughly equivalent. The efficiency consideration was included so as to not provide a disincentive for more efficient fuel use (i.e. a more efficient boiler can have a higher emission intensity, but would emit the same quantity of NOx per year as a less efficient boiler).
Table 3: Proposed Performance Standards for Large Non-utility Boilers and Heaters
| Parameters | NOx Emission Limits (g/GJi) | Compliance Year | ||||
|---|---|---|---|---|---|---|
| Fuel Type | Boiler (see footnote 4) | Heater (see footnote 5) | 2015 | |||
| Modern Equipment | Natural gas | Efficiency | <80% | 16 | N/A | |
| ≥80% | >16 - 18 | |||||
| Preheated combustion air | No | N/A | 16 | |||
| Yes | >16 – 19 | |||||
| Alternative gaseous fuel | Efficiency | <80% | 20.8 | N/A | ||
| ≥80% | >20.8 - 23 | |||||
| Preheated combustion air | No | N/A | 20.8 | |||
| Yes | >20.8 - 25 | |||||
| Original Equipment | Natural gas and/or alternative gaseous fuels | Threshold Level of NOx emissions (g/GJi) | >80 | 26 | 26 | 2026 |
| 70-80 | 26 | 26 | 2036 | |||
| <70 | N/A | N/A | N/A | |||
Original boilers and heaters are those that are in service before the proposed Regulations come into force. Transitional boilers and heaters (see footnote 6) are those that are assembled on site and are in service within up to two years of the proposed Regulations coming into force. Modern boilers and heaters are those that are not original and not transitional, and would be in service after the proposed Regulations come into force.
For original boilers and heaters, these performance standards could be achieved cost-effectively by either retrofitting or replacing the original equipment. The proposed Regulations phase in NOx emission limits over a 20-year period for equipment that emits more than 70 grams per gigajoule input energy (g/GJi). Equipment that currently emits less than 70 g/GJi would not be subject to any performance standards under the proposed Regulations. The performance standards target original equipment in regulated sectors that have no NOx controls, imposing requirements by 2026 for boilers and heaters that currently emit more than 80 g/GJi, and by 2036 for boilers and heaters that emit from 70 g/GJi to 80 g/GJi.
In addition to NOx emission limits, the proposed Regulations would require that boilers and heaters having a rated capacity greater than 262.5 GJi/hr be equipped with Continuous Emission Monitoring Systems (CEMS). CEMS are generally add-on technologies used to demonstrate compliance. CEMS are preferred over other testing methods (such as an annual stack test), because large boilers can emit hundreds of tonnes of NOx each year and thus warrant continuous monitoring.
Cement
The single greatest point source release to the environment of air pollutants of concern from cement manufacturing is a kiln. A kiln heats and processes limestone and other material, such as silica, alumina and ferrous oxide, to produce an intermediate product called clinker. Clinker is then ground and combined with other material to produce cement. The proposed Regulations apply to all cement manufacturing facilities that produce clinker for the purpose of producing grey cement. (see footnote 7) No minimal thresholds are proposed, as all cement facilities are deemed to be significant enough to be subject to the provisions of these Regulations. There are currently four types of kilns in the cement manufacturing sector: wet kilns, long dry kilns, preheater kilns, and precalciner kilns.
The proposed Regulations would impose kiln-specific performance standards for NOx and SO2 per tonne of clinker produced, as outlined in Table 4 below. The proposed Regulations require that CEMS be used to monitor the release of NOx and SO2, starting in 2015, and impose performance standards starting in 2017.
Table 4: Proposed Performance Standards for Cement Kilns
| Pollutant | Kiln type | Performance standard |
|---|---|---|
| NOx | Wet kiln | 2.55 kg/tonne clinker or 30% reduction in emission intensity (kg/tonne of clinker) from 2006 |
| Long dry kiln | ||
| Preheater kiln | 2.25 kg/tonne clinker | |
| Precalciner kiln | ||
| SO2 | All kilns | 3.0 kg/tonne clinker |
These performance standards are consistent with what can be achieved by making operational improvements or installing emissions control technologies that are in place and proven by the cement manufacturing sector. The requirement to use CEMS for monitoring of emissions is a well-established practice within the cement industry. For the cement sector, compliance will be assessed at the facility level. This approach will provide flexibility and assist in minimizing costs by allowing individual facilities to design and implement the operational and equipment modifications required to meet the environmental performance standards for each pollutant of concern.
Regulatory and non-regulatory options considered
Environment Canada will be implementing the BLIERs using a mix of policy instruments. For each BLIER, regulatory and non-regulatory options have been considered in order to determine the optimal approach. The following presents the outcomes of the analysis for the BLIERs in the proposed Regulations only.
a. Status quo approach
Industrial emission requirements help to protect air quality. Currently, the federal government has a limited role related to controlling industrial air pollutants. Actions to manage industrial emissions vary from one province or territory to another, creating a patchwork and an uneven playing field for Canadian enterprises. Canada currently lacks a nationally consistent approach to reducing industrial air pollutant emissions and it is unlikely that a base-level of performance standards can be established across Canada in the absence of federal action. Also, the current approach has not proved sufficient to reduce the health and environmental risks across the country and, under the status quo, U.S. industries generally exceed Canadian performance. Federal action would demonstrate to Canadians and the United States that we are actively managing our air quality, and so the federal government would be in a stronger position to discuss further reductions in transboundary flows of air pollutants with the United States.
b. Market-based instruments
Market-based instruments are one way to provide industry with the flexibility to choose the most cost-effective way to meet the proposed regulatory requirements. However, market mechanisms are not compatible with the fundamental objective of establishing a nationally consistent “emission floor.” For example, a tax on air pollutant emissions would have different effects in different regional contexts, as firms chose whether to pay the tax or invest in abatement equipment, and so no emissions floor could be guaranteed. Since the quantity of emissions reductions cannot be controlled with a tax, this instrument is better suited when an incentive to continually reduce emissions is sought. Similarly, a cap and trade program could lead to no reductions in air pollutant emissions in certain regions where industry elects to pay for permits rather than reduce emissions. Finally, the use of financial incentives or subsidies to industries would be inconsistent with the “polluter pays” principle.
c. Voluntary/alternative instrument approaches
Under certain conditions (e.g. positive history of cooperation, small and motivated regulatory community), voluntary instruments can be effective in achieving emission reductions while providing industry with maximum flexibility.
A Pollution Prevention Planning Notice (P2 Notice) and CEPA 1999 guidance instruments (such as codes of practice and environmental release guidelines) were considered as instruments for implementing the performance standards for engines, boilers and heaters, and cement facilities. These risk management tools can provide more flexibility to regulatees, and are being actively considered for other BLIERs. However, as a result of two key characteristics of the industrial sector/equipment types in the proposed Regulations, these instruments — which do not involve mandatory performance requirements — would not likely ensure that the relevant AQMS sectors would achieve the objective of reducing air pollutant emissions to establish the “emissions floor”:
- (1) Large number of individual entities to be covered: Implementing a large number of facility-specific agreements, such as P2 Notices or Performance Agreements (PAs), could introduce risks regarding inconsistencies in emissions performance across entities. Facility-specific instruments would also have higher administrative costs for government when compared to a regulatory approach. This is a key factor for engines and boilers and heaters.
- (2) Significant variation in industry performance across provinces: The current variation in performance is significant across businesses in a given sector, and it is considered unlikely that instruments which do not set a given performance level would ensure consistency across Canada. This is a key factor for engines, boilers and heaters and the cement sector.
d. Facility-based approach
A facility-based approach provides for an emission obligation for an overall facility, rather than an obligation for each source within that facility. Some operators argue that it is an attractive approach in that it provides them with greater flexibility to prioritize investments to reduce emissions and is likely to result in lower cost to achieve the same emission reductions.
During discussions of the BLIERs working group on boilers and heaters, industry tabled a facility-based proposal. However, after initial discussions, industry withdrew the proposal without stating a reason. A facility-based approach is under consideration in the refineries sector, which could possibly include emissions from boilers and heaters in that sector (note that boilers and heaters in the refineries sector are not subject to the proposed Regulations at this time). For original engines, the fleet average option provides a similar degree of flexibility to a facility-based approach.
e. Regulatory approach under CEPA 1999
Poor air quality is a serious problem and poses an increasing risk for the health and well-being of Canadians and their environment. The Government of Canada announced its intention to regulate emissions from industrial sources in October 2006. A regulatory instrument under CEPA 1999 would
- include mandatory and enforceable air pollutant emission reduction targets;
- require that the common “emissions floor” would be achieved across the country; and
- enable industry to plan their investments with certainty.
During consultations, NGOs clearly indicated that they expect the federal government to require that air pollutant emissions from industrial sources be reduced.
For engines, an alternative regulatory approach was considered for manufacturers of engines. However, manufacturers have indicated that they are not able to ensure emissions levels from engines since the level of emissions is greatly affected by minor adjustments that can be made by the operator of the engine. As a result, the proposed Regulations are considered under Part 5, section 93 of CEPA 1999 where the quantity or concentration of toxic substances released may be regulated.
The recommended approach is to implement consolidated regulations under section 93 of CEPA 1999, respecting substances on the List of Toxic Substances. This would provide an efficient means of setting requirements, including common requirements such as record-keeping, while reducing administrative burden associated with individual regulations, particularly for those firms that would be subject to more than one set of performance standards. Regulations under CEPA 1999 would allow for potential equivalency agreements with interested provinces provided they have instruments that are enforceable by law, that are deemed to have equivalent outcomes to the federal instrument, and that have similar provisions for citizens to request investigations.
Benefits and costs
1. Summary
The proposed Regulations are estimated to result in an aggregate reduction of approximately 2 065 kt of NOx and 96 kt of SO2 over the 2013–2035 period. The net present value (NPV) of the proposed Regulations is estimated to be $6.5 billion for engines, $1.1 billion for boilers and heaters, and $1.4 billion for cement.
The present value of the benefits of the proposed Regulations is estimated to be $7.0 billion for engines, $1.2 billion for boilers and heaters, and $1.5 billion for cement. These benefits arise from avoided hospitalizations and emergency room visits, avoided asthma episodes, and avoided missed work and school days, as well as increased agricultural productivity, reduced soiling, and improved air visibility. The incremental health and environmental benefits for each set of performance standards were estimated separately, and so will not include any interactions with each other. This could lead to a conservative estimate of benefits due to the possibility that the air quality benefits of more than one performance standard in place at the same time could be greater than the sum of the benefits associated with each performance standard in isolation.
The present value of the costs of the proposed Regulations is estimated to be $470 million for engines, $50 million for boilers and heaters, and $43 million for cement, largely due to the incremental costs of the required technologies. Due to the provision of flexible compliance options and differing requirements for new versus existing capital, virtually all capital investments involve “add-on” technologies or the purchase of lower-emitting models at the time of natural capital stock turnover, rather than early retirement of capital stock.
1a. Engines
The performance standards for engines are estimated to result in a reduction of approximately 1 775 kt of NOx emissions between 2013 and 2035. The reduction of NOx emissions is expected to come from (a) the reductions from modern engines; and (b) the reductions from retrofitting or replacing original engines. For original engines, emission reductions would be phased-in in two stages over 11 years; performance requirements would be established for the years 2021 (representing around 50% of original engines) and 2026 (100% of original engines). For modern engines, emission reductions would start in 2013, (see footnote 8) and continue as engines are replaced.
Due to a net reduction in fuel use associated with technologies that meet the proposed performance standards, a reduction of 3.4 Mt of GHG emissions is also estimated over the period. Between 2013 and 2035, the present value of costs of the performance standards for engines is $470 million, largely comprised of engine technology costs ($204 million), and maintenance costs ($189 million). The present value of the benefits is $7.0 billion, comprised of environmental benefits ($245 million), health benefits ($6.5 billion), GHG reduction benefits ($77 million), and net fuel expenditure savings ($152 million).
Overall, the net present value of the proposed performance standards is estimated at $6.5 billion, which translates to a benefit-cost ratio of 15:1.
1b. Boilers and heaters
The performance standards for boilers and heaters would result in a reduction of approximately 227 kt of NOx emissions between 2013 and 2035. The reduction of NOx emissions is expected to result from modern equipment constructed and operated after 2014 and from the replacement of the original fleet of equipment operated after 2014. For the original population of boilers and heaters, emission reductions would be phased-in in two stages. The first stage performance requirements would focus on the heaviest polluting boilers (Class 80), and would require compliance by 2026. The second stage would focus on moderately polluting boilers (Class 70) and would require compliance by 2036. Modern boilers would need to be compliant with performance standards starting in 2015.
Between 2013 and 2035, the present value of the cost of the proposed Regulations is estimated at $50 million, largely due to the additional boiler and heater technology requirements. The present value of the benefits between 2013 and 2035 are estimated at $1.2 billion, which are largely comprised of health benefits ($1.1 billion) and environmental benefits ($29 million).
Overall, the net present value of the proposed Regulations is estimated at $1.13 billion, which translates to a benefit-cost ratio of 24:1.
1c. Cement
The proposed Regulations are estimated to result in a reduction of 96 kt of SO2 and 63 kt of NOx over the 2017 to 2035 period. The reduction of NOx and SO2 emissions is expected to result from the addition of emissions reductions technologies that can be added onto existing infrastructure. These reductions are expected to result in a present value of $1.5 billion in benefits over this period. The comparable costs to achieve these benefits are expected to be $43 million.
Overall, the net present value of the proposed performance standard is estimated at $1.4 billion, which translates to a benefit-cost ratio of 34:1.
2. Analytical framework
In the cost-benefit analysis (CBA), the incremental costs and benefits associated with proposed Regulations are quantified and monetized, to the extent possible.
In order to show the incremental impact of the performance standards specific to each sector/equipment group, a distinct CBA was conducted for each set of performance standards (i.e. a distinct analysis of costs and benefits for engines, boilers and heaters, and cement). Elements of the overall CBA framework that are common across sector/equipment groups are discussed in sections 2 and 3.
It is important to note that the incremental health and environmental benefits for each set of performance standards will not include any interactions with the others. This could lead to a conservative estimate of benefits due to the possibility that the air quality benefits of more than one performance standard in place at the same time could be greater than the sum of the benefits associated with each performance standard in isolation. As a result, the benefits associated with each performance standard should not be added together in an effort to show the combined benefit of the proposed Regulations.
A consistent CBA framework is used for each set of performance standards, and consists of the following elements:
- Incremental impact: Impacts are analyzed in terms of incremental changes in emissions, and direct costs and benefits to stakeholders. The incremental impacts for each set of performance standards were determined by comparing two scenarios: a regulatory scenario and a common business as usual (BAU) scenario.
- Business as usual scenario: The BAU scenario assumes that no regulatory requirements associated with any federal performance standards for engines, boiler and heaters, or cement are in place. Equally, the BAU scenario does not include any subsequent BLIERs. The BAU scenario incorporates all existing provincial/territorial regulations, as well as introduced legislation. The same BAU scenario is used in the analysis of each performance standard (i.e. is common across CBAs).
- Regulatory scenarios: For each set of performance standards, these scenarios assume that a given set of performance standards is implemented.
Table 5 below lays out the elements of the CBA framework applicable to each sector/equipment group.
| Monetized benefits | Monetized costs |
|---|---|
| Health benefits from air pollutant reductions | Incremental capital costs |
| Environmental benefits from air pollutant reductions | Incremental operating and maintenance costs |
| GHG benefits (where applicable) | Incremental administrative costs for businesses |
| Net fuel savings (where applicable) | Incremental government costs |
Further specific detail on the BAU and each regulatory scenario are presented in sections 4, 5 and 6 below.
Timeframe for analysis: The time horizon used for evaluating the impacts is 23 years: 2013 to 2035. The first regulatory requirement comes into force in 2015, but some early action is expected as regulatees make decisions in line with natural capital turn-over cycles. Since certain capital investments incurred prior to 2035 will give rise to annual health and environmental benefits that extend beyond 2035, which are therefore not captured in this analysis, the estimation of benefits should be considered conservative.
Approach to cost and benefit estimates: Incremental costs and benefits have been quantified to the extent possible, estimated in monetary terms, and are expressed in 2012 Canadian dollars.
Discount rate: A real, social discount rate of 3% is used in the analysis for estimating the present value of the costs and benefits, consistent with Treasury Board Secretariat guidelines. This is also consistent with discount rates used for other air quality and greenhouse gas related to the proposed Regulations in Canada. All values are discounted to the year 2013.
3. Modelling and valuing impacts
Different models were used to estimate changes in emissions, and costs and benefits.
3.1 Emissions and economic impact modelling
3.1.1 Energy, Environment and Economic Model for Canada (E3MC)
Air pollutant projections for the years 2011 to 2035 are developed using Environment Canada's Energy, Environment and Economic Model for Canada (E3MC). This model has the ability to capture the interactions that exist within the economy and is capable of analyzing the wider impacts of environmental policies, such as the proposed performance standards, in terms of how the policies will affect the economy, energy prices, emissions, and other macroeconomic indicators.
The E3MC has two components: Energy 2020, which models Canada's energy supply and demand, and The Informetrica Model (TIM), a macroeconomic model of the Canadian economy.
Energy 2020, which includes many regions and sectors of the North American economy, (see footnote 9) has the capacity to simulate the supply, price and demand for all fuels. The model can determine energy output and prices for each sector, both in regulated and unregulated markets. It simulates how such factors as energy prices and government measures affect the choices that consumers and businesses make when they buy and use energy. The model's outputs include changes in energy use, energy prices, greenhouse gas emissions, air pollutants, investment costs and possible cost savings, which are used to identify the direct effects stemming from greenhouse gas, energy or air pollutant reduction measures. The resulting cost savings and investments from Energy 2020 are then used as inputs into TIM.
The Informetrica Model is used to examine consumption, investment, production, and trade decisions in the whole economy. It captures the interaction, from a national perspective, among industries, as well as the implications for changes in producer prices, relative final prices, and income. It also factors in government fiscal balances, monetary flows, and interest and exchange rates. More specifically, TIM incorporates gross domestic product, gross output and employment for 133 industries at a provincial and territorial level. It also has an international component to account for exports and imports, covering about 100 commodities. The model projects the direct impacts on the economy's final demand, output, employment, price formation, and sectoral income that result from various policy choices. These, in turn, permit an estimation of the effect of clean air and climate change policy and related impacts on the national economy.
The E3MC develops air pollutant emissions projections using an approach based on market economics to analyze trends in energy use. For each fuel and consuming sector, the model balances energy supply and demand accounting for economic competition among the various energy sources. The model generates an annual emissions projection and can then assess policy options by examining the changes in key parameters relevant to the BAU scenario within the modelling framework.
3.1.2 Key assumptions and data sources in the E3MC
Economic assumptions in the E3MC are based on the Government of Canada's short-term economic outlook as forecast by Finance Canada in 2012. Long-term economic projections were developed using TIM and are tuned to productivity growth projections and Statistics Canada's 2010 population growth projections. With respect to major energy supply project assumptions, for this analysis, forecasts of major energy supply projects are based on the National Energy Board's fall 2011 outlook.
The projections also incorporate data from the National Inventory Report (1990–2010: Greenhouse Gas Sources and Sinks in Canada), (see footnote 10) the National Energy Board, and the U.S. Energy Information Administration for the latest information on key parameters.
3.2 Air quality modelling
The E3MC-modelled air pollutant emissions for the BAU and regulatory scenarios are translated into projected emissions inventories of detailed point, area and mobile sources matching the E3MC outputs. Subsequently, these spatially allocated emission reductions are inputted into A Unified Regional Air-Quality Modelling System (AURAMS) to predict how the emission changes will affect local air quality. (see footnote 11) AURAMS is a fully three-dimensional state-of-the-art numerical model described in peer-reviewed scientific literature. (see footnote 12) AURAMS combines information on predicted emission changes with information on wind speed, temperatures, humidity levels, and existing pollution levels, in order to predict how these emissions changes will impact local air quality. (see footnote 13) The meteorological data used for all modelled scenarios is generated by Environment Canada's weather forecast model.
The AURAMS' air quality modelling system was run for two reference years (2025 and 2035) for the engines, boilers and heaters, and cement regulatory scenarios and for the common BAU scenario (i.e. eight different projections).
3.3 Environmental valuation modelling
Using the resulting ambient air quality impacts from AURAMS, environmental benefits are estimated using Environment Canada's Air Quality Valuation Model 2 (AQVM2).
The environmental benefits estimated by AQVM2 include
- — increased agricultural productivity associated with lower ambient levels of ozone (changes in sales revenues for Canadian crops producers, based on exposure-response functions);
- — reduced soiling associated with lower particulate deposition (avoided cleaning costs for households); and
- — changes in welfare associated with visibility improvement (based on household willingness-to-pay estimates from a Canadian study).
Overall, particulate matter and ozone negatively impact upon vegetation, soils, water, wildlife, materials, as well as overall ecosystem health. As chronic exposure to ozone may result in crop yield losses, physiological degradation of vegetation, reduced timber growth, and premature livestock mortalities and illnesses, reducing these pollutants can reduce associated economic costs for the agri-food and forestry industries. In addition, the degraded visibility associated with particulate suspension and smog may negatively affect residential welfare, tourism and the enjoyment of outdoor recreational activities. Particulate deposition is also associated with soiling and structural damages, which may lead to higher cleaning and maintenance costs for residential dwellings, commercial buildings and industrial facilities.
In order to estimate the benefits for all of the years between 2013 and 2035, interpolation and extrapolation techniques were used. The precise techniques varied according to the emission trends relevant to each BLIER, and are discussed in more detail in sections 4, 5, and 6, respectively.
3.4 Health valuation modelling
Using the ambient air quality impacts from AURAMS, the resulting health risks and impacts are estimated by Health Canada using the Air Quality Benefits Assessment Tool (AQBAT). (see footnote 14)
The human health impacts estimated by AQBAT include
- — avoided premature mortalities (based on the value of a statistical life and the reduction in the per capita risk of death);
- — avoided emergency room visits and hospitalization;
- — avoided asthma episodes; and
- — avoided days of breathing difficulty and reduced activity.
Overall, air pollution ultimately contributes to premature mortality and a number of health-related problems, such as cardiovascular ailments and respiratory diseases, yielding negative impacts such as emergency room visits, hospital admissions, lost productivity and decreased well-being. Controlling releases of NOx and SO2 in application of the proposed Regulations is expected to lead to a decrease in ambient air concentrations of particulate matter and ozone. The human health benefits associated with the NOx and SO2 emissions reductions are estimated based on changes in ambient concentrations of these pollutants and the secondary formation of particulate matter and ozone as determined by photochemical air quality and exposure modelling, as discussed above.
As mentioned above, the precise interpolation and extrapolation techniques used varied according to the emission trends relevant to each sector/equipment group, and are discussed in more detail in sections 4, 5, and 6 respectively.
3.5 Social cost of carbon
The estimated value of damages avoided through GHG reductions is based on the climate change damages avoided at the global level. These damages are usually referred to as the social cost of carbon (SCC). The SCC is used in the modelling of the cost-benefit analysis of environmental regulations to quantify the economic impacts of incremental changes in GHG emissions. It represents an estimate of the economic value of avoided climate change damages at the global level for current and future generations as a result of reducing GHG emissions. The calculations of the SCC are independent of the method used to reduce emissions.
Estimates of the SCC between and within countries vary due to challenges in predicting future emissions, damages, and determining the appropriate weight to place on future costs relative to near-term costs (discount rate). The United States also use SCC values in the cost-benefit analysis of regulations. The values used by Environment Canada are similar to two of the values used in the United States and are based on the work of the U.S. Interagency Working Group on the Social Cost of Carbon.
Social cost of carbon values used in this assessment draw on ongoing work by Environment Canada (see footnote 15) in collaboration with a federal interdepartmental working group and in consultation with a number of external academic experts. This work involves reviewing existing literature and other countries' approaches to valuing GHG emissions. Recommendations based on current literature, in line with the approach adopted by the U.S. Interagency Working Group on the Social Cost of Carbon in 2010, (see footnote 16) are that it is reasonable to estimate a central set of SCC values starting at CAN$29.06/tonne of CO2 in 2013. (see footnote 17) Environment Canada's review also concludes that a higher-bound value starting at $115.18/tonne in 2013 should also be considered (see footnote 18) in the cost-benefit analysis to reflect right-skewed probability distributions (i.e. 95th percentile value) of the SCC. (see footnote 19) Use of the higher value reflects consideration of low probability, high-cost climate damage scenarios. A value of $115.18 per tonne does not, however, reflect the extreme end of SCC estimates, as some studies have produced values exceeding $1 000 per tonne of carbon emitted. Social cost of carbon values increase over time to reflect the increasing marginal damages of climate change as projected GHG concentrations increase.
The federal interdepartmental working group on the SCC concluded that it is necessary to continually review the above estimates in order to incorporate advances in physical sciences, economic literature and modelling to ensure the SCC estimates remain current. Environment Canada will continue to collaborate with the federal interdepartmental working group and with outside experts to review and incorporate as appropriate new research on the SCC in the future.
4. Benefits and costs — Engines
4.1 Analytical framework
4.1.1 Equipment profile — Engines
A stationary spark-ignition gaseous-fuel-fired engine (“engine”) is primarily used for the compression of natural gas in the oil and gas sector. The Canadian population of engines comprises rich-burn and lean-burn engines. Lean-burn engines tend to be more efficient and produce lower NOx emissions than rich-burn engines, since the excess air ensures a more complete combustion of the fuel and reduces the temperature of the combustion process. Exhaust emissions can be reduced using post-combustion control, such as non-selective catalytic reduction (NSCR), or passive emission control technology for NOx, such as rich-to-lean engine management systems or pre-combustion chambers. Engine fleets are largely owned and/or operated by oil and gas firms, and the size of engine fleets ranges from a few engines to hundreds of engines.
Although the proposed performance standards would apply to modern engines in several sectors, the vast majority (i.e. over 95%) of modern engines are expected to be found in the oil and gas sector [defined here as upstream oil and gas (UOG) and natural gas transmission pipelines (NGT)]. Further, the proposed performance standards would apply to original engines in the oil and gas sectors only. Therefore, the impacts of the proposed performance standards are assessed for the oil and gas sector only.
4.1.2 Business as usual scenario
In the BAU scenario, technology choices which affect NOx emissions remain constant over the period of the analysis for the starting inventory of engines. Engine quantities are expected to fluctuate in proportion to oil and gas production forecasts. The BAU scenario analysis estimates the impacts of original and modern engines in the absence of the proposed federal Regulations in terms of capital, maintenance, fuel consumption, and emissions. In the BAU scenario, engine models are expected to be replaced at the end of their useful life (see section 4.1.4) with engines of the same power.
The BAU scenario takes into consideration emission reductions that, in accordance with existing provincial legislation, are expected to occur (i.e. by replacing engines with compliant engines according to provincial requirements). The legislation considered includes the Alberta Environmental Protection and Enhancement Act, which states requirements for modern engines over 600 kW, and the Oil and Gas Waste Regulation of British Columbia's Environmental Management Act, which sets requirements for modern engines over 100 kW.
4.1.3 Regulatory policy scenario
The proposed Regulations would impose performance standards for both modern and original engines, as set out in Table 2.
The regulatory scenario uses the same assumptions as in the BAU scenario regarding life expectancy rates and fluctuation of the engine population in proportion to oil and gas production forecasts.
The regulatory scenario assumes that the most cost-effective NOx emission-reducing technologies will be chosen to comply with the proposed performance standards (see section 4.1.4), until fleet-wide performance standards are met. Where capital investment is assumed to be necessary to meet the performance standards, either (a) retrofit technologies are applied to original engines or (b) lower-emitting modern engine models are assumed to be purchased. Capital investment timing for original engine retrofits is assumed to be the year prior to the coming into force of performance standards (2020 and 2025), as no action is required prior to these dates. As in the BAU scenario, modern engines are assumed to be installed at the time of natural capital stock turnover or when required due to increased demand for engines. All retrofit technology and replacement options in this analysis are currently available on the market.
In British Columbia, since the proposed performance standards for modern engines are identical to what is already in place in the province, no incremental emission reduction efforts are expected for modern engines. For the population of modern engines in Alberta with capacity greater than 600 kW, the regulatory policy scenario captures the differential between the existing Alberta requirements (6 g/kWh) and the proposed performance standards (2.7 g/kWh). Retrofits to original engines required to meet the proposed performance standards are considered to be incremental in all provinces, and therefore the associated retrofit costs and benefits are attributed to the proposed performance standards.
4.1.4 Key data and assumptions
To assess the impact of the performance standards for engines, it was necessary to quantify the Canadian population of engines from 2013 to 2035 and to project technology choices that would be available to comply with the proposed performance standards. Based on available technology choices, the expected changes in engine technology across the Canadian fleet would produce benefits and costs, as considered in sections 4.2 and 4.3, respectively.
- Quantifying the Canadian population of engines
To project the quantity of engines in the UOG sector, it was necessary to estimate the 2012 inventory of original engines, the normal engine replacement rate, and demand for engines beyond 2013. The analysis uses an inventory of engines from seven large Canadian companies provided by the Canadian Association of Petroleum Producers (CAPP) as a starting inventory. This inventory is then scaled up to obtain the total Canadian population using the proportion of emissions in the 2010 air pollutant emission summary contributed by sector and province/territory, assuming that engines account for 85% of UOG emissions. The analysis assumes that UOG engine models last 20, 40 or 60 years (see footnote 20) on average, depending on engine model speed.
For the NGT sector, a starting inventory of engines was provided by the Canadian Energy Pipeline Association (CEPA). These engines are assumed to be replaced with turbines at their end of life. Engines in the NGT sector are assumed to last more than 60 years, since they often see intermittent use, burn high-quality fuel gas, and are well maintained given their large size and high capital cost.
Table 6 illustrates the resulting starting quantities of engines by engine power and sector.
| Engine power | Sector | Canada |
|---|---|---|
| ≥250 kW | NGT | 81 |
| UOG | 5 921 | |
| ≥75 kW and <250 kW | UOG | 2 282 |
| Total | 8 258 | |
Engine demand was estimated using the E3MC model. In addition to replacements due to normal capital turn-over cycles, the equipment quantities fluctuate yearly based on projections of oil and gas production in both the BAU and policy scenarios. Original engines are replaced as their respective end of life is reached (i.e. the technology used in replacement engines may differ between the BAU and regulatory scenario, but the timing of replacement is the same in both scenarios). The resulting projected quantities of engines in the policy scenario are depicted in Tables 7 and 8, respectively. The process for identifying retrofit or replacement options for original and modern engines and attributing associated engine costs is discussed in section 4.3 (Costs).
| Engine category | 2013–2020 | 2021–2025 | 2026–2030 | 2031–2035 | Total |
|---|---|---|---|---|---|
| ≥75 kW and <250 kW original engines replaced (due to age) | 342 | 285 | 285 | 285 | 1 198 |
| ≥75 kW and <250 kW modern engines (due to sector growth/contraction) | -429 | 8 | 36 | 97 | -287 |
| ≥ 250 kW original engines replaced (due to age) | 980 | 765 | 569 | 488 | 2 801 |
| ≥250 kW modern engines (due to sector growth/contraction) | -803 | 15 | 55 | 118 | -615 |
| ≥250 kW original engines retrofitted with rich-to-lean engine management system | 22 | 696 | 0 | 0 | 718 |
| ≥250 kW original engines retrofitted with non-selective catalyst | 0 | 351 | 0 | 0 | 351 |
| ≥250 kW original engines replaced with a modern engine equipped with pre-combustion chamber | 70 | 70 | |||
| Total engines replaced or retrofitted | 1 344 | 2 097 | 854 | 774 | 5 069 |
| Total engines taken out of operation or added due to sector growth/contraction | -1 232 | 24 | 91 | 215 | -902 |
Note: Negative engine quantities refer to engines that are not required due to a projected decrease in UOG production. This occurs in both the BAU and regulatory scenarios. These engines are assumed to be taken out of operation and could be preserved for future use.
| Engine category | 2013–2020 | 2021–2025 | 2026–2030 | 2031–2035 | Total |
|---|---|---|---|---|---|
| ≥250 kW original engines retrofitted with rich-to-lean engine management system | 8 | 1 | 0 | 0 | 9 |
| ≥250 kW original engines retrofitted with non-selective catalyst | 12 | 6 | 0 | 0 | 18 |
| ≥250 kW original engines replaced with modern engines equipped with pre-combustion chamber | 3 | 9 | 0 | 0 | 12 |
| Engines retired due to age | 1 | 5 | 0 | 0 | 6 |
| Total engines replaced or retrofitted | 24 | 21 | 0 | 0 | 45 |
- Estimating changes in engine emissions
To model engine emissions data for the BAU and regulatory scenarios, engine power, load, utilization, and specific emission factors corresponding to a given engine in the inventory were calculated for 292 different engine models in the inventory on a per-engine basis. The data with which this was done was provided by CAPP and CEPA from their respective engine inventories and assumptions were made to determine the load and the utilization of engines. (see footnote 21) Emission factors (i.e. the average rate of emissions per unit of energy produced) are held constant in the baseline, whereas the regulatory scenario applies to emission factors that correspond to the most cost effective technology required to meet the proposed performance standards. (see footnote 22) In the regulatory scenarios, it is assumed that rich-burn engines still available on the market are replaced with rich-burn engines equipped with rich-to-lean engine management systems or catalytic reduction. Rich-burn engines and lean-burn engines no longer available on the market are assumed to be replaced with lean-burn engines equipped with pre-combustion chambers, and lean-burn engines still available on the market are assumed to be replaced with the same model. (see footnote 23) The resulting reduction in NOx emissions was used to determine environmental and health benefits.
4.2 Benefits — Engines
4.2.1 Air pollutant reductions
The performance standards for modern and original engines are expected to reduce NOx emissions by about 1 775 kt between 2013 and 2035, which is expected to result in lower levels of smog and overall better air quality. Air pollutant reductions begin in 2013, as it is expected that firms would purchase compliant technology at the time of natural capital turnover, given advance notice of performance standards.
4.2.2 Interpolation of air quality impacts
In order to estimate the benefits for all of the years between 2013 and 2035, interpolation and extrapolation techniques were used. As all original engines are expected to comply with the requirements by 2026, it is assumed that emission reductions associated with the policy significantly spike in 2025 compared to previous years (in preparation for the requirements). Therefore, linear interpolation between 2013 and 2025 would not properly capture the overall pattern of emissions reductions in this period. Instead, the annual benefits in this period were proxied by pro-rating the 2025 value by the proportion of NOx emission reductions for each year between 2013 and 2024. (see footnote 24) For the period between 2025 and 2035, the 2025 values were linearly interpolated to the 2035 values, as the variability in emission changes in this period was considered negligible.
4.2.3 Air quality improvements
Reductions in NOx emissions resulting from the proposed performance standards for engines are expected to result in lower levels of ambient particulate matter and ground-level ozone. These are the two main components of smog, therefore reductions will result in significant human health and environmental benefits.
4.2.4 Environmental benefits
The Air Quality Valuation Model 2 assesses the impacts associated with agricultural productivity, soiling and visibility from a change in ambient air quality. The estimated national environmental benefits linked with the performance standards for engines are expected to be approximately $245 million dollars for the period between 2013 and 2035. Table 9 presents the estimated environmental benefits, broken down by impact and by province/territory.
Soiling and visibility impacts for Newfoundland and Labrador, Prince Edward Island and Nova Scotia are not presented because a precise assessment of the changes in ambient levels of particulate matter was not possible within these provinces, due to the marginal changes in emissions involved. Impacts on agriculture in the territories are also omitted as census of agriculture data is unavailable for this region.
| Environmental impact Economic indicator |
Agriculture Change in Sales Revenues for Crop Producers |
Soiling Avoided Costs for Households |
Visibility Change in Welfare for Households |
Total |
|---|---|---|---|---|
| Newfoundland and Labrador | - | N/A | N/A | - |
| Prince Edward Island | 0.1 | N/A | N/A | 0.1 |
| Nova Scotia | 0.1 | N/A | N/A | 0.1 |
| New Brunswick | 0.1 | - | - | 0.2 |
| Quebec | 2.9 | 0.2 | 0.7 | 3.8 |
| Ontario | 10.8 | 0.6 | 1.9 | 13.2 |
| Manitoba | 11.0 | 0.3 | 1.8 | 13.0 |
| Saskatchewan | 67.8 | 0.6 | 4.2 | 72.7 |
| Alberta | 101.5 | 8.2 | 31.0 | 140.8 |
| British Columbia | 0.7 | 0.2 | 0.7 | 1.5 |
| Yukon | N/A | - | - | - |
| Northwest Territories | N/A | - | - | - |
| Nunavut | N/A | - | - | - |
| Canada | 195.0 | 10.2 | 40.2 | 245.4 |
Note: Results are expressed in constant 2012 dollars (millions) using a 3% discount rate to a base year of 2013. Totals may not add up due to rounding. A dash (-) indicates values are below $50,000. N/A indicates data is unavailable for this region.
As the performance standards for engines are expected to significantly reduce NOx emissions, the proposed Regulations will result in decreased ambient concentrations of ground-level ozone. Based on exposure-response functions for 19 different crops, AQVM2 provides the changes in production (tonnes) and expected total sales revenue per census agricultural region (CAR) due to changes in levels of ozone. National benefits from increased agricultural productivity, expressed in the present value of sales revenue over the period, are expected to be approximately $195 million. Due to the important NOx emission reductions expected in Alberta and the extensive farmlands being affected, the province is expected to receive more than half of the national benefits. The significant agricultural benefits in Saskatchewan are mainly attributable to ozone reductions from reduced emissions from Alberta (spillover impacts), combined with typical eastward air flow patterns and extensive agricultural activity in Saskatchewan.
The Air Quality Valuation Model 2 estimates the avoided cleaning costs for Canadian households associated with different levels of particulate matter of 10 micrometres or less (PM10). Over the period, avoided household cleaning costs of about $10.2 million are expected. These benefits should be considered as conservative as they do not account for avoided cleaning costs in the commercial and industrial sectors. Alberta obtains the largest share of national benefits.
All else being equal, visibility increases as ambient concentrations of particulate matter decrease. Based on willingness to pay for improved visual range and AURAMS outcome of ambient air quality, AQVM2 estimates the monetary change in welfare for different levels of deciviews. (see footnote 25) Welfare gains from improved visibility in the residential sector are approximately $40.2 million over the period, with Alberta obtaining the largest share of the cumulative national benefits.
In summary, the estimated national combined environmental benefits associated with the performance standards for engines are expected to be approximately $245 million over the period. The estimates should be considered as conservative since only the impacts on soiling, visibility and agricultural productivity were assessed by AQVM2. Other environmental impacts were not assessed due to data or methodological limitations, such as the impacts of improved visibility on tourism revenues; reduced acid deposition on forests, crops and water ecosystems; reduced smog on livestock and wildlife mortality; and lower emissions of short-lived climate forcers (black carbon) on climate change, amongst others.
4.2.5 Health benefits
While there are some direct health benefits of lower ambient levels of NOx, it is the contribution of this pollutant to secondary formation of PM and ozone in the atmosphere that has the greatest impact on human health. As shown in Table 10, approximately half of the health benefits from the emission reductions are associated with lower ambient levels of ground-level ozone. Another 35% of the benefits are a result of reduction in fine particulate matter, with the remainder attributable to reductions in ambient NOx levels.
Over the 2013 to 2035 period, the reductions in pollutants associated with this initiative are expected to result in approximately 1 400 fewer premature mortalities, 1 600 fewer emergency room visits, 320 000 fewer days of asthma symptoms and 1 000 000 fewer days of restricted activity in non-asthmatics. The present value of these health benefits over the period is estimated to be about $6.5 billion, of which, approximately three quarters are accrued in Alberta ($4.8 billion). The benefits by region are shown in the table below.
| Region | Aggregate counts of selected health impacts | Present Value of Total Avoided Health Outcomes by Pollutant ($ Millions) | ||||||
|---|---|---|---|---|---|---|---|---|
| Premature Mortalities | Cardiac and Respiratory Emergency Room Visits | Asthma Symptom Days | Days of Restricted Activity in Non-asthmatics | PM2.5 | Ozone | Other (NOx) | Total | |
| Newfoundland and Labrador | 1 | 2 | 250 | 420 | - | 4.9 | - | 4.9 |
| Prince Edward Island | <1 | <1 | 110 | 180 | - | 2.0 | - | 2.0 |
| Nova Scotia | 3 | 4 | 650 | 1 100 | - | 12.5 | 0.1 | 12.6 |
| New Brunswick | 3 | 4 | 770 | 1 400 | 0.3 | 14.3 | 0.1 | 14.7 |
| Quebec | 49 | 60 | 11 000 | 26 000 | 50.1 | 166.4 | 2.7 | 219.2 |
| Ontario | 130 | 150 | 30 000 | 78 000 | 153.0 | 378.9 | 39.6 | 571.4 |
| Manitoba | 50 | 69 | 13 000 | 33 000 | 62.8 | 159.2 | 1.7 | 223.8 |
| Saskatchewan | 94 | 120 | 21 000 | 59 000 | 139.6 | 270.5 | 14.1 | 424.2 |
| Alberta | 1 100 | 1 200 | 230 000 | 780 000 | 1 885.1 | 2 061.1 | 891.1 | 4 837.3 |
| British Columbia | 38 | 46 | 9 100 | 26 000 | 52.4 | 109.4 | 11.8 | 173.5 |
| Yukon | <1 | <1 | 55 | 130 | 0.2 | 0.8 | - | 1.0 |
| Northwest Territories | <1 | <1 | 190 | 480 | 0.7 | 1.8 | 0.1 | 2.6 |
| Nunavut | <1 | <1 | 10 | 21 | - | 0.1 | - | 0.1 |
| Canada | 1 400 | 1 600 | 320 000 | 1 000 000 | 2 344.1 | 3 181.7 | 961.2 | 6 487.1 |
Note: PM2.5 health impacts for Newfoundland and Labrador, Prince Edward Island and Nova Scotia are not presented as a precise assessment of these very marginal changes in ambient levels of particulate matter was not possible. Values are expressed in constant 2012 dollars (millions) using a 3% discount rate to base year 2013. Totals may not add up due to rounding. A dash (-) indicates values are below $50,000.
4.2.6 Avoided costs — Net fuel savings
Engine operators are expected to meet the proposed performance standards by adopting engine technologies that reduce NOx emissions. Some of these technologies for some engine models improve engine efficiency while reducing emissions. In the regulatory scenario, fuel saved as a result of the replacement of engines due to natural capital turnover and the retrofit of, or replacement with, engines equipped with rich-to-lean-burn engine management systems outweigh increased fuel consumption by engines retrofitted or replaced with those equipped with catalytic reduction. To calculate avoided cost due to reduced fuel consumption, energy savings were converted to fuel savings using standard metrics. The technologies applied are expected to reduce natural gas consumption by 65.7 million MMBtu over the period of 2013–2035. The estimated value of avoided fuel cost associated with the decreased consumption is $152 million. (see footnote 26)
Net fuel savings benefits are negative at the start of the period since a greater number of engines are replaced with engines equipped with catalytic reduction, which range from being 1%–4% less efficient than technology that would otherwise be applied in the BAU scenario. Beyond 2020, the net fuel saved (and thus GHG avoided) increases as more equipment is replaced by or retrofitted with rich-to-lean engine management systems and pre-combustion chamber equipped engines.
4.2.7 Greenhouse gas benefits
The estimated reduction in fuel consumed in the regulatory scenario relates to a decrease of 3.4 million tonnes of CO2 over the period of 2013–2035. Based on current literature, and in line with the approach adopted by the U.S. Interagency Working Group on the Social Cost of Carbon in 2010, (see footnote 27) the recommendation of the federal interdepartmental working group is that it is reasonable to use two SCC values: (1) a “central value” of $29.06/tonne of CO2 in 2013, increasing at a given percentage each year associated with the expected growth in damages; and (2) a “higher bound value” starting at $115.18/tonne in 2013, reflecting arguments raised by academic experts regarding the treatment of right-skewed probability distributions of the SCC in cost-benefit analyses.
Based on an estimated SCC central value, the present value of incremental GHG emission benefits is estimated to be approximately $77 million over the period of 2013–2035. (see footnote 28) Based on the higher bound value, the present value of incremental GHG emission benefits is estimated to be approximately $305 million over the same period.
4.2.8 Total benefits
It is estimated that the present value of aggregate national environmental, health, avoided fuel consumption and GHG benefits associated with the performance standards for engines will amount to about $6.96 billion over the period. Figure 1 shows the distribution of environmental and health benefits across Canada. The vast majority of the expected benefits are in Alberta.
Figure 1: Aggregated Present Value of Environmental and Health Benefits Associated with the Performance Standards for Engines, by Canadian Province/Territory (2013–2035)
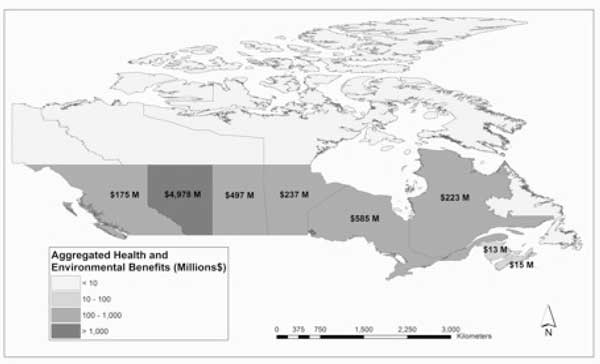
Note: Results are expressed in constant 2012 dollars (millions) using a 3% discount rate to a base year of 2013.
4.3 Costs — Engines
4.3.1 Costs to operators of engines
In the analysis, incremental costs are incurred as technology in the Canadian fleet of engines changes to comply with the proposed performance standards.
For modern engines, Environment Canada identified cost-effective replacement technologies that could be applied practically and economically. The analysis considered several parameters, including whether or not an engine model is available for purchase on the market, capital cost, maintenance cost, and the fuel consumption characteristics for each engine model and retrofit option. The most cost-effective option for each model is considered to be the minimum total capital and operating cost relative to NOx reduction potential. Where specific engine model cost characteristics were not available, the cost of a model with a similar rated power was applied. If new or lower-priced technologies become available on the market at a lower cost, then actual costs of implementation would be lower. Figure 2 depicts the framework for the replacement of original engines at end of life. Table 11 and Table 12 illustrate the range of costs associated with control technologies by engine type.
Figure 2: Framework for Replacement of Original Engines When They Reach End of Life (UOG Sector)
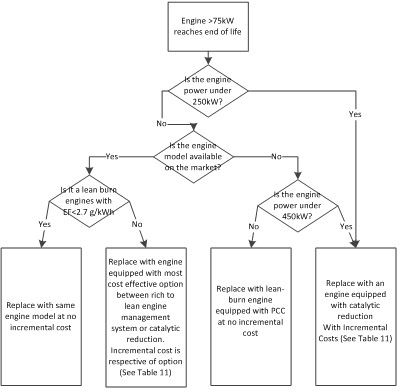
| Engine type | Control Technology | One-Time Incremental Capital Cost per Engine ($) | Annual Incremental Maintenance Cost per Engine ($) | Annual Incremental Fuel Consumed per Engine (%) |
|---|---|---|---|---|
| Rich-burn <250 kW, no longer available for purchase | Non-selective catalytic reduction at 2.7 g/kWh | 40,000 | 20,000 | +2% |
| Rich-burn still available for purchase | Non-selective catalytic reduction at 2.7 g/kWh | 40,000 to 120,000 | 20,000 to 28,000 | +2% to +4% |
| Rich-to-lean engine management system at 2.7 g/kWh | 55,000 to 159,600 | -15,000 | -5% |
Note: Values are expressed in constant 2012 dollars.
Since the fleet average NOx changes that result from natural replacement are not sufficient to bring the Canadian fleet into compliance with performance standards associated with the years 2021 and 2026, original engines remaining in the population were then assumed to be retrofitted or replaced with the most cost-effective technology option until fleet-wide performance standards were achieved. To meet performance standards, 22 engines were required to be retrofitted before 2021, and 1 117 were required to be retrofitted (1 047) or replaced (70) before 2026. The range of costs associated with the retrofit options used in the analysis is presented in Table 12, depending on the engine model.
| Control technology | One-time capital cost per engine ($) | Annual incremental operation and maintenance cost per engine — excluding fuel ($) | Annual incremental fuel consumed per engine (%) |
|---|---|---|---|
| Rich-to-lean engine management system | 55,000 to 125,000 | -15,000 | -10% to -5% |
| Non-selective catalytic reduction | 35,000 to 185,000 | 3,000 to 9,000 | +1% to +2% |
| Replacement with pre-combustion chamber (PCC) equipped engine | 883,500 to 2,549,779 | -71,992 to -17,459 | -29% to -19% |
Note: Values are expressed in constant 2012 dollars.
- Capital costs
For this analysis, the incremental capital cost is (1) the total incremental cost of retrofit technology when applied to an original engine; and (2) the incremental cost of compliant modern engines compared to non-compliant modern engines. The present value of capital cost over the period 2013 to 2035 is presented in Table 13.
- Non-fuel operating and maintenance costs
Operating costs are considered to be the incremental annual cost of maintenance attributable to technology choices required to meet the performance standards in the regulatory scenario. As outlined in Tables 11 and 12 above, some technologies that meet the performance standards are estimated to require additional maintenance on an annual basis (non-selective catalytic reduction) whereas others are estimated to require less maintenance (rich-to-lean engine management system). The net effect of technology choices on maintenance cost is positive (i.e. a net incremental cost) for the choices modelled. The present value of maintenance cost over the period from 2013 to 2035 is presented in Table 13.
- Administrative costs
Administrative costs include estimated costs of learning about the regulations, preparing, updating and submitting the engine registry, notifying the Minister when a responsible person elects to use the fleet average option, reporting the operating hours of low-use engines, the test results and the fleet average as well as preparing and maintaining records (as described in detail in the section ‘“One-for-One” Rule' below). The present value of reporting and administrative costs over the period from 2013 to 2035 is presented in Table 13.
- Other compliance costs
Other compliance costs include estimated costs of conducting tests, preparing engines for testing, adjustment of air-fuel ratio, and calculation of fleet-wide or flat-limit emissions. The present value of these other compliance costs over the period 2013 to 2035 is presented in Table 13.
- Total compliance costs
Total compliance costs are estimated to be $463 million over the period 2013 to 2035.
| Present value | 2013–2020 | 2021–2025 | 2026–2030 | 2031–2035 | Combined 2013–2035 |
|---|---|---|---|---|---|
| Capital costs | 47.2 | 135.7 | 10.6 | 10.2 | 203.7 |
| Non-fuel operating and maintenance | 52.9 | 47.7 | 39.4 | 49.1 | 189.1 |
| Administrative costs | 0.3 | 0.5 | 0.4 | 0.3 | 1.4 |
| Other compliance costs | 8.8 | 24.1 | 19.5 | 16.3 | 68.7 |
| Total cost for operators of engines | 109.2 | 208.0 | 69.9 | 75.9 | 462.9 |
Note: Results are expressed in constant 2012 dollars (millions) using a 3% discount rate to a base year of 2013. Totals may not add up due to rounding.
4.3.2 Costs to Government
Costs of the Regulations to the Government of Canada fall into three principal categories: compliance promotion costs, enforcement costs, and regulatory administration costs. The estimates of these are described below.
Compliance promotion: It is anticipated that incremental compliance promotion costs for the federal government would be $534,000 from 2013 to 2035 to account for the effort required to inform businesses about the proposed Regulations. Compliance promotion activities may include information sessions and the distribution of promotional material. Particular emphasis would be placed on the new emissions standards and reporting requirements. All compliance promotion activities would be adjusted according to compliance analyses or if unforeseen compliance challenges arise.
Enforcement: The federal government would incur incremental costs related to training, inspections, investigations, and measures to deal with any alleged violations. With respect to enforcement costs, a one-time amount of $233,000 would be required for the training of enforcement officers and to meet information management requirements. The total present value of enforcement costs over the period are estimated to be about $4.4 million, comprising the costs of inspections (which include operation and maintenance costs, transportation and sampling costs), investigations, measures to deal with alleged violations (including warnings, environmental protection compliance orders and injunctions) and prosecutions.
Regulatory administration: Administration costs are expected to be incurred by the federal government in order to develop reporting infrastructure and to support submissions from regulatees on an ongoing basis. The present value of reporting and administrative costs over the period from 2013 to 2035 is approximately $2.4 million.
The present value of the costs related to these three categories are estimated to total $7.3 million over the 2013 to 2035 period in this analysis, and are presented in Table 14.
4.4 Summary of benefits and costs — Engines
Table 14 below summarizes the benefits and costs of the proposed performance standard for engines.
| Incremental costs and benefits | 2013–2020 | 2021–2025 | 2026–2030 | 2031–2035 | Total 2013–2035 |
|---|---|---|---|---|---|
| Undiscounted | Discounted | ||||
| A. Quantified impacts ($ millions) Benefits to Canadians |
|||||
| Environmental benefits (agriculture, soiling, visibility) | 22.9 | 58.3 | 151.4 | 155.2 | 245.4 |
| GHG benefits (central) | -0.3 | 11.1 | 54.5 | 61.9 | 76.8 |
| Health benefits | 522.4 | 1,329.0 | 3,876.3 | 4,670.4 | 6,486.8 |
| Benefits to industry (net fuel savings) | -1.1 | 41.0 | 102.7 | 105.0 | 152.3 |
| Total benefits | 543.9 | 1,439.4 | 4,184.9 | 4,992.5 | 6,961.3 |
| Costs to industry | |||||
| Capital costs | 53.9 | 190.9 | 16.6 | 18.4 | 203.7 |
| Non-fuel operating and maintenance | 60.6 | 63.5 | 61.6 | 89.0 | 189.1 |
| Administrative costs | 0.3 | 0.6 | 0.6 | 0.6 | 1.4 |
| Other compliance costs | 10.5 | 32.4 | 30.4 | 29.4 | 68.7 |
| Subtotal | 125.3 | 287.4 | 109.2 | 137.4 | 462.9 |
| Costs to Government | |||||
| Compliance promotion, enforcement, and regulatory administration | 4.2 | 1.9 | 1.8 | 1.8 | 7.3 |
| Total costs | 129.5 | 289.3 | 111.0 | 139.2 | 470.2 |
| Net benefits (with central value of SCC) | 414.4 | 1,150.1 | 4,073.9 | 4,853.3 | 6,491.1 |
| Benefit-to-cost ratio (central) | 4.2 | 5.0 | 37.7 | 35.9 | 14.8 |
| B. Quantified impacts (SCC value at 95th percentile) | |||||
| GHG benefits | -1.2 | 44.2 | 216.4 | 245.4 | 304.7 |
| Total benefits | 543.0 | 1,472.5 | 4,346.8 | 5,176.0 | 7,189.2 |
| Net benefits (with 95th percentile of SCC) | 413.5 | 1,183.2 | 4,235.8 | 5,036.8 | 6,719.0 |
| C. Quantified impacts, non-monetized — e.g. from a risk assessment | |||||
| Reduction in fuel consumed (MMBtu) | -40,228 | 10,983,299 | 27,013,596 | 27,693,682 | 65,650,348 |
| Reduction in NOx (kt) | 133 | 297 | 678 | 667 | 1,775 |
| Reduction in GHG (kt) | -2 | 568 | 1,397 | 1,432 | 3,396 |
Note 3*
All numbers are undiscounted except for total (present value) numbers, which are discounted to 2013 using a 3% discount rate.
5. Benefits and costs — Boilers and heaters
5.1 Analytical framework
5.1.1 Equipment profile
A boiler or a heater is used primarily to generate steam for industrial processes and heating. Boilers and heaters comprise a burner, the combustion chamber, pressure vessel (only for boilers) and control/monitoring equipment. The design of the burner is the most important determinant of NOx emissions intensity. In most cases, burners can be swapped out of a given system for burners that were designed for lower NOx emission intensities. Burners tend to reach the end of their useful life before the pressure vessel and other components.
Large (over 10.5 GJi/hr rated capacity) gaseous-fuelled boilers and heaters affected by the proposed performance standards are found in most AQMS sectors, but are most prevalent in the oil sands, upstream oil and gas, and pulp and paper sectors.
5.1.2 Business as usual scenario
The business as usual scenario assumes that the proposed Regulations are not implemented and that utilization of boiler and heater technologies which affect NOx emissions remains consistent over the period of the analysis. Equipment is replaced with equipment of the same rated capacity. Quantities of boilers and heaters are expected to grow in parallel to the energy demand by each industrial sector (as described in section 5.1.4). The BAU scenario therefore accounts for the projected boiler and heater population for 2013 to 2035 and estimates the resulting emissions.
5.1.3 Regulatory scenario
The proposed performance standards would limit the amount of NOx that large gaseous-fuelled boilers and heaters in AQMS sectors are permitted to emit for modern and original equipment. Performance standards are listed in Table 3.
For original equipment, the proposed Regulations gradually phase-in NOx emission limits over time. Original equipment that emits NOx at the highest intensity (i.e. greater than 80 g/GJi, or “Class 80”) would be required to meet the performance standards by 2026. Equipment emitting between 70 g/GJi and 80 g/GJi (“Class 70”) would be required to meet the performance standards by 2036. Nonetheless, since the population of equipment affected by the original equipment performance standards all approach or exceed the end of their useful engineering life by the time compliance dates would come into force, it is expected that firms are likely to replace rather than retrofit these boilers, and therefore be subject to the requirements for modern equipment. Installation, operation and maintenance are assumed to be equivalent in the BAU and regulatory scenario.
Original equipment that emits less than 70 g/GJi is not subject to performance standards as long as they remain below this level. They would, however, be subject to the modern equipment performance standards when they are replaced with modern equipment due to natural capital turn-over.
Modern boilers and heaters (i.e. those that are installed after the proposed Regulations come into effect, whether as a replacement for original equipment, or new modern equipment resulting from economic growth) must be compliant with the performance standards for modern equipment as listed in Table 3.
5.1.4 Key data and assumptions
Data and assumptions described below were used in the BAU and policy scenario to (1) define the Canadian population of boilers and heaters; (2) estimate boiler and heater emissions; and (3) estimate incremental costs. Each is discussed below.
- Quantifying the Canadian population of boilers and heaters
A starting inventory of currently installed boilers and heaters was constructed based on information received from provincial safety authorities. (see footnote 30) This inventory is considered to be representative of the Canadian population of equipment, and served as the 2012 starting inventory of equipment for both the BAU and policy scenario. The number of modern and original boilers and heaters was then projected by year from 2013 to 2035 using the year installed for each boiler and assuming an equipment life of 40 years. (see footnote 31) Where original equipment were already beyond the 40-year expected life, it is assumed they would be replaced 5 years after the proposed Regulations enter into force (i.e. by 2020).
In addition to replacements due to normal capital turn-over cycles, it was assumed that equipment quantities would fluctuate by year to reflect projected sector growth or decline in production in both the BAU and policy scenario. The projected energy demand and demand for energy using equipment for each sector in each province was estimated using E3MC. The model forecasts an increase in energy demand mainly for the following sectors: chemicals manufacturing in Ontario and Alberta; oil sands in Alberta, and upstream oil and gas in British Columbia. It is assumed that for sectors in which production is forecasted to decline, original boilers and heaters would be removed from the starting inventory. Similarly, for sectors in which production is forecasted to increase, modern equipment of sufficient power would be added. (see footnote 32) Table 15 and 16 below show the expected distribution of equipment in 2035 by AQMS sector and province, respectively. These distributions are the same in the BAU and regulatory scenarios, since the performance standards do not affect the timing of replacement decisions.
| description | Original Population (Including Replacements) | Projected Modern Units Due to Economic Growth | Total | Percentage of Canadian Total |
|---|---|---|---|---|
| Pulp and paper | 89 | 1 | 90 | 7% |
| Chemicals | 71 | 31 | 102 | 8% |
| Oil sands | 140 | 341 | 481 | 39% |
| Upstream oil and gas | 413 | 37 | 450 | 36% |
| Base metal smelting | 48 | 1 | 49 | 4% |
| Potash | 56 | 1 | 57 | 5% |
| Iron, steel and ilmenite | 2 | 0 | 2 | <1% |
| Aluminum and alumina | 9 | 1 | 10 | 1% |
| Total | 828 | 413 | 1 241 | 100% |
| Province | Quantity | Percent of Total |
|---|---|---|
| Alberta | 934 | 75% |
| British Columbia | 77 | 6% |
| New Brunswick | 4 | <1% |
| Ontario | 93 | 8% |
| Quebec | 55 | 4% |
| Saskatchewan | 78 | 6% |
| Total | 1 241 | 100% |
- Estimating changes in boiler and heater emissions
In the BAU scenario, emission factors based on the size of the boiler or heater and the year installed were used to estimate the NOx emissions from original equipment. (see footnote 33), (see footnote 34) Table 17 below provides a breakdown of the emission factors used in the analysis based on equipment capacity and commissioning date.
| Boiler and Heater Capacity (GJi/hr) | Commissioning Date | NOx Emission Factor (g/GJi) |
|---|---|---|
| 10.5 to <105 | 1900 to 1990 | 42 |
| 10.5 to <105 | 1991 to 2012 | 26 |
| 105 and > | 1900 to 1980 | 117 |
| 105 and > | 1981 to 1990 | 79 |
| 105 and > | 1991 to 2012 | 40 |
| 10.5 to <105 | After 2014 | Weighted Average by Sector |
| 105 and > | After 2014 | Weighted Average by Sector |
In the policy scenario, it is assumed that the emission factors associated with all equipment would meet the performance standards for modern and original equipment. Table 18 provides a breakdown of the resulting emission factors used in the policy scenario for equipment installed or replaced after the Regulations come into force.
| Boiler and Heater Capacity (GJi/hr) | Original/Modern | NOx Emission Factor (g/GJi) |
|---|---|---|
| >10.5 | Original | 26 |
| >10.5 | Modern | 16 (see footnote 35) |
- Estimating incremental costs
When a boiler or heater is replaced at the end of its expected equipment life, or if a modern boiler or heater is installed due to an increase in forecasted energy demand, capital costs are based on the assumption that low-NOx burner (LNB) technology would be installed. Other options are available, including catalytic reduction; however, these were not retained as they are considered to be less cost-effective alternatives for reducing NOx compared to the integration of low-NOx burners.
In all cases, the incremental capital cost is assumed to be the difference in purchase price between a conventional burner and a burner with LNB technology included.
The incremental cost of LNB technology per unit used in this analysis is estimated at $74,000 (or approximately 4% greater than the capital cost of an entire new conventional boiler). This is consistent with information provided by a boiler retailer. Sensitivity analysis explores a range of incremental capital compliance costs in section 7.
Continuous emission monitoring systems (CEMS) are also required for boilers and heaters that have a rated capacity of greater than 262.5 GJi/hr. Based on available information, it is assumed CEMS is in place for all original boilers in this range, and all modern boilers would be equipped with CEMS in the BAU scenario. Therefore, no incremental cost is attributed to emissions monitoring equipment in the regulatory scenario.
As LNB technology does not affect equipment efficiency or other performance aspects, no other incremental fuel or maintenance costs are assumed.
5.2 Benefits — Boilers and heaters
5.2.1 Air pollutant reductions
Emissions of criteria air contaminants (CAC) are precursors to the formation of ozone and secondary particulate matter. The performance standards for modern and original boilers and heaters are expected to reduce nitrogen oxide (NOx) emissions by about 227 kt between 2013 and 2035, which would result in lower levels of smog and overall better air quality.
5.2.2 Interpolation of air quality impacts
In order to estimate the benefits for all of the years between 2013 and 2035, interpolation and pro-rating techniques were used. As a cohort of original boilers and heaters (which are considered to already have exceeded their useful life) will be replaced in 2020, emission reductions for that year are significantly higher compared to 2019. Therefore, the annual benefits were proxied by pro-rating the 2025 values by the annual proportions of NOx emission reductions between 2013 and 2025. (see footnote 36) For the period between 2025 and 2035, the 2025 values were linearly interpolated to the 2035 values as the emission reductions were increasing at a relatively smooth rate.
5.2.3 Air quality improvements
Reductions in NOx emissions resulting from the proposed performance standards for boilers and heaters are expected to result in lower levels of ambient particulate matter and ground-level ozone. These are the two main components of smog; therefore, reductions will result in human health and environmental benefits.
5.2.4 Environmental benefits
The Air Quality Valuation Model 2 assesses the impacts associated with agricultural productivity, soiling, and visibility. The estimated national environmental benefits linked with the implementation of the performance standards for boilers and heaters are expected to be approximately $29 million (in constant 2012 dollars, discounted to the year 2013 with a 3% discount rate) for the period between 2013 and 2035. Table 19 presents the estimated environmental benefits, broken down by impact and by province/ territory.
| Environmental impact Economic indicator |
Agriculture Change in Sales Revenues for Crop Producers |
Soiling Avoided Costs for Households |
Visibility Change in Welfare for Households |
Total |
|---|---|---|---|---|
| Newfoundland and Labrador | - | - | - | - |
| Prince Edward Island | - | - | - | - |
| Nova Scotia | - | - | - | 0.1 |
| New Brunswick | - | - | - | 0.1 |
| Quebec | 1.5 | 0.5 | 1.9 | 3.9 |
| Ontario | 4.4 | 0.7 | 2.7 | 7.8 |
| Manitoba | 1.5 | 0.1 | 0.3 | 1.9 |
| Saskatchewan | 7.4 | 0.1 | 0.5 | 7.9 |
| Alberta | 4.9 | 0.3 | 1.1 | 6.3 |
| British Columbia | - | 0.1 | 0.3 | 0.5 |
| Yukon | N/A | - | - | - |
| Northwest Territories | N/A | - | - | - |
| Nunavut | N/A | - | - | - |
| Canada | 19.8 | 1.8 | 7.0 | 28.5 |
Note: Results are expressed in constant 2012 dollars (millions) using a 3% discount rate to a base year of 2013. Totals may not add up due to rounding. A dash (-) indicates values are below $50,000. N/A indicates data is unavailable for this region.
The performance standards for boilers and heaters will result in decreased ambient concentrations of ground-level ozone. Based on exposure-response functions for 19 different crops, AQVM2 provides the change in production (tonnes) and total sales revenue per census agricultural region (CAR) due to changes in levels of ozone. National benefits from increased agricultural productivity, expressed in the present value of sales revenue, are expected to be approximately $20 million. Altogether, Alberta, Ontario and Saskatchewan are expected to receive about 80% of the national benefits.
The Air Quality Valuation Model 2 estimates the avoided cleaning costs for Canadian households associated with different levels of particulate matter of 10 micrometres or less (PM10). Over the period, avoided household cleaning costs of about $2 million are expected. Ontario obtains the largest share of national benefits, followed by Quebec and Alberta. These benefits should be considered as conservative as they do not account for avoided cleaning costs in the commercial and industrial sectors.
All else being equal, visibility increases as ambient concentrations of particulate matter decrease. Based on willingness to pay for improved visual range, AQVM2 estimates the monetary change in welfare for different levels of deciviews. Welfare gains from improved visibility in the residential sector are approximately $7 million over the period, with Ontario and Quebec obtaining about two-thirds of the cumulative national benefits.
In summary, between 2013 and 2035, the estimated present value of national environmental benefits associated with the performance standards for modern and original boilers and heaters are expected to be approximately $29 million. The estimates should be considered as conservative since only the impacts on soiling, visibility and agricultural productivity were assessed by AQVM2. Other environmental impacts were not assessed due to data or methodological limitations, such as the impacts of improved visibility on tourism revenues; reduced acid deposition on forests, crops and water ecosystems; reduced smog on livestock and wildlife mortality; and lower emissions of short-lived climate forcers (black carbon) on climate change, amongst others.
5.2.5 Health benefits
While there are some direct health benefits of lower ambient levels of NOx, it is the contribution of this pollutant to secondary formation of PM and ozone in the atmosphere that has the greatest impact on human health. As shown in Table 20, approximately 40% of the health benefits from the emission reduction are associated with lower ambient levels of ground-level ozone. Another 38% of the benefits are a result of reduction in PM2.5, with the remainder attributable to reductions in ambient NO2 levels.
Over the 2013 to 2035 period, the reductions in pollutants associated with these performance standards are expected to result in approximately 250 fewer premature mortalities, 250 fewer emergency room visits, 44 000 fewer days of asthma symptoms and 150 000 fewer days of restricted activity in non-asthmatics. The present value of these health benefits over the period is estimated to be about $1.15 billion. The benefits by region are shown in Table 20 below.
| Region | Cumulative Counts of Selected Health Impacts | Present Value of Total Avoided Health Outcomes by Pollutants ($ Millions) | ||||||
|---|---|---|---|---|---|---|---|---|
| Premature Mortalities | Cardiac and Respiratory Emergency Room Visits | Asthma Symptom Days | Days of Restricted Activity in Non Asthmatics | PM2.5 related | Annual and Summer Ozone | Other (NOx) | Total | |
| Newfoundland and Labrador | <1 | <1 | 68 | 130 | 0.1 | 1.3 | - | 1.4 |
| Prince Edward Island | <1 | <1 | 37 | 81 | 0.1 | 0.7 | - | 0.8 |
| Nova Scotia | 1 | 1 | 240 | 520 | 0.7 | 4.7 | - | 5.4 |
| New Brunswick | 2 | 2 | 290 | 690 | 1.4 | 5.6 | 0.2 | 7.2 |
| Quebec | 61 | 56 | 9 100 | 34 000 | 114.9 | 125.6 | 41.0 | 281.6 |
| Ontario | 100 | 90 | 15 000 | 62 000 | 208.3 | 147.5 | 108.6 | 464.4 |
| Manitoba | 7.2 | 9.4 | 1 800 | 5 100 | 12.1 | 21.0 | 0.3 | 33.4 |
| Saskatchewan | 11 | 14 | 2 600 | 7 200 | 16.5 | 31.6 | 3.0 | 51.1 |
| Alberta | 47 | 55 | 11 000 | 33 000 | 71.4 | 95.2 | 50.9 | 217.5 |
| British Columbia | 20 | 21 | 3 700 | 11 000 | 30.3 | 50.6 | 10.1 | 90.9 |
| Yukon | <1 | <1 | 2.4 | 5 | - | - | - | - |
| Northwest Territories | <1 | <1 | 24 | 49 | - | 0.2 | - | 0.3 |
| Nunavut | <1 | <1 | 1.5 | 2.9 | - | - | - | - |
| Canada | 250 | 250 | 44 000 | 150 000 | 455.8 | 484.0 | 214.2 | 1,154.1 |
Note: Results are expressed in constant 2012 dollars (millions) using a 3% discount rate to a base year 2013. Totals may not add up due to rounding. A dash (-) indicates values are below $50,000.
5.2.6 Total benefits
It is estimated that the present value of aggregate national environmental and health benefits associated with the performance standards for boilers and heaters will amount to about $1.15 billion over the period. The chart below shows the distribution of these benefits across Canada.
Figure 3: Health and Environmental Present Value of Benefits Associated with the Performance Standards for Boilers and Heaters, by Canadian Province/Territory (2015–2035)
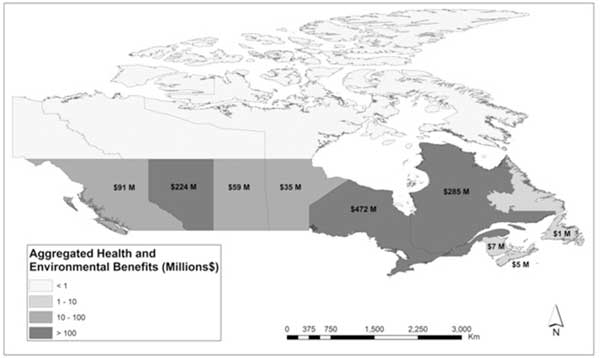
Note: Results are expressed in constant 2012 dollars (millions) using a 3% discount rate to a base year of 2013.
5.3 Costs — Boilers and heaters
5.3.1 Incremental costs to operators of boilers and heaters
- Capital costs
As noted above, incremental capital costs are considered to be the difference between the cost of conventional equipment and the cost of compliant LNB equipment, both of which are currently available on the market. Total incremental capital costs are therefore obtained by taking the quantity of equipment replaced and installed in a given year and multiplying by the corresponding incremental cost. Results are presented in Table 21 and Table 22 below. In the future, if new or lower-priced technologies become available on the market, then actual costs of implementation would be lower.
| Sector | 2013–2020 | 2021–2025 | 2026–2030 | 2031–2035 | Total 2013–2035 |
|---|---|---|---|---|---|
| Pulp and paper | 4.5 | 2.4 | 2.0 | 1.0 | 10.0 |
| Chemicals | 2.7 | 2.4 | 1.9 | 0.9 | 8.0 |
| Oil sands | 9.6 | 5.5 | 5.2 | 2.7 | 23.1 |
| Upstream oil and gas | 0.8 | 1.0 | 1.1 | 0.5 | 3.5 |
| Base metal smelting | 1.0 | 0.8 | 0.6 | 0.3 | 2.6 |
| Potash | 0.5 | 0.2 | 0.2 | 0.1 | 0.6 |
| Iron, steel and ilmenite | <0.1 | <0.1 | <0.1 | <0.1 | <0.1 |
| Aluminum and alumina | <0.1 | <0.1 | <0.1 | <0.1 | <0.1 |
| All sectors | 18.7 | 12.2 | 10.9 | 5.7 | 47.6 |
Note: Results are expressed in constant 2012 dollars (millions) using a 3% discount rate to a base year of 2013. Totals may not add up due to rounding.
| Province | 2013–2020 | 2021–2025 | 2026–2030 | 2031–2035 | Total 2013–2035 |
|---|---|---|---|---|---|
| Alberta | 12.0 | 8.2 | 7.4 | 3.9 | 31.5 |
| British Columbia | 0.8 | 0.7 | 0.7 | 0.3 | 2.5 |
| Ontario | 2.5 | 1.5 | 1.4 | 0.8 | 6.3 |
| Quebec | 2.8 | 1.5 | 1.2 | 0.6 | 6.1 |
| New Brunswick | 0.4 | - | - | - | 0.5 |
| Saskatchewan | 0.1 | 0.2 | 0.2 | 0.1 | 0.7 |
| Canada | 18.7 | 12.2 | 10.9 | 5.7 | 47.6 |
Note: Results are expressed in constant 2012 dollars (millions) using a 3% discount rate to a base year of 2013. Totals may not add up due to rounding. A dash (-) indicates that values are below $50,000.
- Operating costs
Operating costs are estimated to be equivalent in the BAU and policy scenario, since LNB technology does not require any additional maintenance or other operating costs compared to comparable conventional boilers. Therefore, there are no incremental operating costs.
- Administrative costs
Administrative costs include estimated costs of learning about the regulations, preparing and submitting reports and maintaining records (as described in detail in the section ‘“One-for-One” Rule' below). The present value of reporting and administrative costs over the period from 2013 to 2035 is approximately $0.3 million.
- Total compliance costs
Total compliance costs are estimated to be $48 million over the period 2013 to 2035.
5.3.2 Costs to Government
Costs of the proposed Regulations to the Government of Canada fall into three principal categories: compliance promotion costs, enforcement costs, and regulatory administration costs. The estimates of these costs are described below.
Compliance promotion: It is anticipated that total present value compliance promotion costs would be $46,000 from 2013 to 2035. Compliance promotion activities may include the distribution of promotional material to explain the proposed Regulations. Particular emphasis would be placed on the new emissions standards and reporting requirements. All compliance promotion activities would be adjusted according to compliance analyses or if unforeseen compliance challenges arise.
Enforcement: A one-time amount of $233,000 is expected to be required for the training of enforcement officers and to meet information management requirements. In addition, ongoing enforcement costs are estimated to total $1.5 million, over the period from 2013 to 2035, comprising the cost for inspections (which includes operations and maintenance costs, transportation and sampling costs), investigations, financial measures to deal with alleged violations (including warnings, environmental protection compliance orders and injunctions) and prosecutions.
Government administration: Government administration costs are expected to be incurred by the Government in order to develop reporting infrastructure and to support submissions on an ongoing basis. The present value of reporting and administrative costs over the period from 2013 to 2035 is approximately $0.5 million.
5.4 Summary of benefits and costs — Boilers and heaters
Table 23 below summarizes the benefits and costs of the proposed performance standards for boilers and heaters.
| Incremental costs and benefits | 2013–2020 | 2021–2025 | 2026–2030 | 2031–2035 | Total 2013–2035 Discounted |
|---|---|---|---|---|---|
| Undiscounted | |||||
| A. Quantified impacts ($ millions) Benefits to Canadians |
|||||
| Environmental benefits (agriculture, soiling, visibility) | 4.0 | 10.0 | 13.3 | 16.8 | 28.5 |
| GHG benefits | N/A | N/A | N/A | N/A | N/A |
| Health benefits | 140.3 | 354.7 | 537.8 | 775.7 | 1,154.1 |
| Total benefits | 144.3 | 364.7 | 551.1 | 792.5 | 1,182.6 |
| Costs to industry | |||||
| Capital costs | 21.4 | 16.5 | 17.1 | 10.2 | 47.6 |
| Administrative costs | 0.2 | 0.1 | 0.1 | 0.1 | 0.3 |
| Subtotal | 21.6 | 16.6 | 17.2 | 10.3 | 47.9 |
| Costs to Government | |||||
| Compliance promotion, enforcement, and regulatory administration | 1.3 | 0.8 | 0.4 | 0.4 | 2.2 |
| Total costs | 22.9 | 17.4 | 17.6 | 10.7 | 50.1 |
| Net benefits | 121.4 | 347.3 | 533.5 | 781.8 | 1,132.5 |
| Benefit-to-cost ratio | 6.3 | 21.0 | 31.4 | 74.1 | 23.6 |
| B. Quantified impacts, non-monetized — e.g. from a risk assessment | |||||
| Reduction in NOx (kt) | 21.2 | 53.5 | 69.0 | 83.0 | 226.7 |
Note 4*
All numbers are undiscounted except for total (PV) numbers, which are discounted to 2013 using a 3% discount rate.
6. Benefits and costs — Cement
6.1 Analytical framework
6.1.1 Sector profile
There are 15 grey cement facilities distributed across Canada. Together, these facilities produced about 15 million tonnes of cement in 2008 worth more than $1.7 billion, of which 4.1 million tonnes were exported (largely to the United States). Cement and concrete sales are responsible for over $8.8 billion in sales contributing over $3.2 billion to Canada's gross domestic product. Over 27 000 Canadians are employed in the Canadian cement industry to produce cement, ready mix concrete and concrete construction materials. The environmental performance varies significantly between Canadian grey cement facilities. Canadian grey cement production and shipments are directly related to the level of infrastructure activity in Canada and parts of the United States. Concrete manufacturers represent the dominant downstream linkage to the cement manufacturing sector, accounting for 90% of cement output. Canada's concrete value chain is somewhat vertically integrated. (see footnote 37)
6.1.2 Business as usual (BAU) scenario
The BAU scenario assumes that cement facilities will not change their emissions intensities for NOx and SO2 emissions between 2013 and 2035. (see footnote 38) The BAU scenario also assumes that NOx and SO2 emissions grow at the same rate as production of cement over time, which in turn varies based on regional economic demand forecasts produced by E3MC. The BAU scenario emission levels for NOx and SO2 facilities were calculated on an annual basis using confidential data on production and emission levels provided to Environment Canada by industry under section 71 of CEPA 1999, in 2006. Based on these emission intensities, it is estimated that a minority of facilities operate with emissions intensities greater than those allowable in the proposed performance standards, and it is assumed that these facilities will not adopt emission-reduction measures unless regulated.
6.1.3 Regulatory scenario
The regulatory scenario assumes that a minority of facilities that are not already attaining the performance standards for the cement sector would adopt a mix of technologies and practices at the start of 2017 that will allow them to reach an emission intensity level consistent with the performance standards listed in Table 4. In addition, a minority of facilities not currently using continuous emission monitoring systems (CEMS) to measure releases of and report on pollutants would need to do so by 2015.
6.1.4 Key data and assumptions
This analysis assumes that, in both the BAU and regulatory scenarios, the number of facilities remains constant over time.
Information regarding the emissions intensities of existing facilities was obtained from a variety of sources, including
- a report by Cheminfo Services on the Canadian cement sector, 2008; (see footnote 39)
- a cost model developed by the U.S. Environmental Protection Agency (EPA), 2007; (see footnote 40)
- a report by the European Commission on the cement industry, 2010; (see footnote 41)
- confidential information provided to Environment Canada by industry under section 71 of CEPA 1999, in 2006; and
- industry stakeholder consultations during the BLIERs process.
6.2 Benefits — Cement
6.2.1 Air pollutant reductions
The performance standards in the cement sector are expected to reduce aggregate SO2 and NOx emissions by 96 kt, and 63 kt, respectively, between 2017 and 2035. These emission reductions will result in lower levels of smog and overall better air quality.
6.2.2 Interpolation of air quality impacts
As noted above, in order to estimate the benefits for all of the years between 2013 and 2035, interpolation and extrapolation techniques were used. Since efforts to attain compliance with the proposed performance standards are expected to be taken in 2017, benefits were assumed to be zero until 2017. Benefits were linearly interpolated between 2025 and 2035 and linearly extrapolated between 2017 and 2025 by extending the slope of the 2025–2035 period. This approach is based on the trend in projected emission reductions, which exhibits low variability between 2017 and 2035.
For confidentiality reasons, since the number of cement production facilities in Canada is limited, benefits will be aggregated regionally to prevent identification of facilities that would need to take steps to meet the performance requirements. Therefore, Canadian results are divided into three regions:
- — West (British Columbia, Alberta, Saskatchewan and Manitoba);
- — Ontario; and
- — East (Quebec, New Brunswick and Nova Scotia). (see footnote 42)
6.2.3 Air quality improvements
Reductions in NOx emissions resulting from the proposed performance standards for cement manufacturing facilities are expected to result in lower levels of ambient particulate matter and ground-level ozone. These are the two main components of smog; therefore, reductions will result in human health and environmental benefits.
6.2.4 Environmental benefits
The Air Quality Valuation Model 2 assesses the impacts associated with agricultural productivity, soiling, and visibility. The estimated national environmental benefits linked with the implementation of the performance standards in the cement sector are expected to be approximately $30.8 million dollars (discounted at 3%) for the period between 2017 and 2035. Table 24 presents the estimated environmental benefits, broken down by impact and region.
| Environmental impact Economic indicator |
Agriculture Change in Sales Revenues for Crops Producers |
Soiling Avoided Costs for Households |
Visibility Change in Welfare for Households |
Total |
|---|---|---|---|---|
| East | 0.5 | 2.6 | 10.8 | 13.9 |
| Ontario | 1.8 | 1.1 | 5.4 | 8.3 |
| West | 6.9 | 0.3 | 1.4 | 8.6 |
| Canada | 9.1 | 4 | 17.6 | 30.8 |
Note: Results are expressed in constant 2012 dollars (millions) using a 3% discount rate to a base year of 2013. No environmental benefits are expected for years 2015 and 2016. Totals may not add up due to rounding.
The performance standards for the cement sector would result in decreased ambient concentrations of ground-level ozone. Based on exposure-response functions for 19 different crops, AQVM2 provides the change in production (tonnes) and total change in sales revenue per Census Agricultural Region (CAR) due to changes in levels of ozone. National benefits from increased agricultural productivity, expressed in the present value of sales revenue, are expected to be approximately $9.1 million over the period. The West region is expected to receive more than 75% of the national benefits, as agricultural lands and most of the NOx emission reductions are concentrated in this region.
The Air Quality Valuation Model 2 estimates the avoided cleaning costs for Canadian households associated with different levels of particulate matter of 10 micrometres or less (PM10). Over the period, avoided household cleaning costs of about $4.0 million are expected, mainly in the East region. These benefits should be considered as conservative as they do not account for avoided cleaning costs in the commercial and industrial sectors. Soiling can also generate short circuits on electrical distribution lines.
All else being equal, visibility increases as ambient concentrations of particulate matter decrease. Based on willingness to pay for improved visual range, AQVM2 estimates the monetary change in welfare for different levels of deciviews. Welfare gains from improved visibility in the residential sector are approximately $17.6 million over the period. Consistent with the SO2 emission reductions, the largest benefits are expected in the East region.
In summary, between 2017 and 2035, the estimated present value of national combined environmental benefits associated with the performance standards for cement are expected to be approximately $31 million. The estimates should be considered as conservative since only the impacts on agricultural productivity, soiling, and visibility were assessed by AQVM2. Other environmental impacts were not assessed due to data or methodological limitations, such as the impacts of improved visibility on tourism revenues; reduced acid deposition on forests, crops and water ecosystems; reduced smog on livestock and wildlife mortality; and lower emissions of short-lived climate forcers (black carbon) on climate change, amongst others.
6.2.5 Health benefits
While there are some direct health benefits of lower ambient levels of NOx and SO2, it is the contribution of these pollutants to secondary formation of PM in the atmosphere that has the greatest impact on human health. As shown in Table 25, approximately two thirds of the health benefits from the emission reduction are associated with lower ambient levels of PM2.5. Another 20% of the benefits are a result of reduction in ambient ozone levels, with the remainder attributable to reductions in ambient NOx and SO2 levels.
Over the 2017 to 2035 period, the reductions in pollutants associated with this initiative are expected to result in approximately 300 fewer premature mortalities, 220 fewer emergency room visits, 31 000 fewer days of asthma symptoms and 220 000 fewer days of restricted activity. The present value of these health benefits (discounted at 3%) is estimated to be about $1.5 billion over the period. The benefits by region are shown in Table 25 below.
| Region | Aggregate Counts of Selected Health Impacts | Present Value of Total Avoided Health Outcomes by Pollutants (in 2013, $ Millions) | ||||||
|---|---|---|---|---|---|---|---|---|
| Premature Mortalities | Cardiac and Respiratory Emergency Room Visits | Asthma Symptom Days | Days of Restricted Activity in Non Asthmatics | PM 2.5 Related | Annual and Summer Ozone | Other (SO2 and NOx) | Total | |
| East | 170 | 90 | 9 000 | 120 000 | 639.4 | 60.7 | 128.4 | 828.5 |
| Ontario | 86 | 71 | 11 000 | 70 000 | 284.2 | 108.7 | 27.1 | 420.0 |
| West | 44 | 57 | 12 000 | 34 000 | 68.4 | 130.5 | 8.6 | 207.5 |
| Canada | 300 | 220 | 31 000 | 224 000 | 992.0 | 299.9 | 164.1 | 1,456.0 |
Note: Monetized results are expressed in constant 2012 dollars (millions) using a 3% discount rate to a base year of 2013. No incremental health benefits are expected for years 2015 and 2016. Totals may not add up due to rounding.
6.2.6 Total benefits
It is estimated that the present value of national environmental and health benefits associated with the performance standards for cement will amount to about $1.5 billion over the period.
6.3 Costs — Cement
The proposed Regulations would impose costs on the cement industry and the federal government.
6.3.1 Incremental costs to cement industry
There are a number of demonstrated practices and technologies in the cement sector in Canada that can be used to meet the performance standards for NOx and SO2 emissions. Technologies adopted to comply with the proposed performance standards will likely differ across facilities to fit their specific physical and process factors. These technologies are already well established within the cement industry and can be implemented at relatively low cost to a company.
For the purpose of cost calculations, this analysis assumes that selective non-catalytic reduction (SNCR) is the technology chosen by each cement facility that needs to take actions to meet the performance standards for NOx emissions, and that lime injection is the technology chosen by each cement facility that needs to take action to meet the performance standards for SO2 emissions. Although there are other options, these technologies are representative in that they appear to be the most commonly implemented within the Canadian sector and well established in the global cement sector as technologies that can be added on to a kiln system to reduce NOx and SO2 emissions.
In addition, facilities which have not already installed CEMS would need to do so by 2015 in order to meet the monitoring standards of the proposed Regulations.
- Capital costs
Capital costs that would be incurred by facilities in order to acquire the technologies needed for compliance were modelled as one-time expenditures in 2017 for NOx and SO2 technologies and one-time expenditures in 2015 for monitoring technologies. In addition, it was assumed that all three technologies have a useful life of 20 years, a constant rate of effectiveness over time, and that they do not impact production or non-regulated emissions. Table 26 below provides a summary of the capital costs of these technologies considering the number of units expected to be purchased by non-compliant facilities.
| Technology | Number of Facilities | Cost per Unit | Total Undiscounted (2015–2035) [$ Millions] | Total Present Value (2015–2035) [$ Millions] |
|---|---|---|---|---|
| SNCR (NOx) | 5 | 1,040,090 | 5.2 | 4.7 |
| Lime injection (SO2) | 4 | 451,226 | 1.8 | 1.6 |
| CEMS (monitoring) | 3 | 355,311 | 1.1 | 1.0 |
| Total capital costs | 8.1 | 7.3 | ||
Note: Results are expressed in constant 2012 dollars. Present value costs are discounted to the year 2013 with a 3% discount rate to a base year of 2013. The number of facilities which are expected to adopt a given technology cannot be published due to confidentiality concerns. Totals may not add up due to rounding.
- Operating costs
Facilities that need to take action to comply with the performance standards would also incur incremental annual operating costs from 2015 to 2035 inclusively. Table 27 below includes operating costs associated with each emission control technology included in the analysis.
| Technology | Annual Operating Cost per Unit | Total Undiscounted (2015–2035) [$ Millions] | Total Present Value (2015–2035) [$ Millions] |
|---|---|---|---|
| SNCR (NOx) | Varies by facility based on clinker production — $0.50/tonne clinker | 26.5 | 18.3 |
| Lime injection (SO2) | Varies between $177,000–$353,000/facility | 19.5 | 13.5 |
| CEMs (monitoring) | $60,000 | 4.2 | 3 |
| Total operating costs | 50.2 | 34.8 | |
Note: Results are expressed in constant 2012 dollars. Present value costs are discounted to the year 2013 with a 3% discount rate to a base year of 2013. The number of facilities which are expected to adopt a given technology cannot be published due to confidentiality concerns. Totals may not add up due to rounding.
- Reporting/administrative costs
Administrative costs include estimated costs of learning about the regulations, preparing and submitting reports and maintaining records (as described in detail in the section ‘“One-for-One” Rule' below). The present value of reporting and administrative costs over the period is approximately $21,000.
- Total compliance costs
It is estimated that the present value of total compliance costs associated with the performance standards for the cement sector will amount to $42.1 million in present value terms, as shown in Table 28 below.
| Region | Capital Costs | Operating Costs | Reporting Costs | Total |
|---|---|---|---|---|
| East | 1.8 | 8.6 | Less than 0.5 | 10.5 |
| Ontario | 2.7 | 16.3 | Less than 0.5 | 19.0 |
| West | 2.8 | 9.9 | Less than 0.5 | 12.6 |
| Canada | 7.3 | 34.8 | Less than 0.5 | 42.1 |
Note: Results are expressed in constant 2012 dollars (millions) using a 3% discount rate to a base year of 2013.
6.3.2 Costs to Government
Costs to the Government of Canada associated with the proposed performance standards fall into three principal categories: compliance promotion costs, enforcement costs, and regulatory administration costs. The estimates of these costs are described below.
Compliance promotion: It is anticipated that total present value compliance promotion costs would be $67,100 from 2015 to 2035. Compliance promotion activities may include the distribution of promotional material to explain the proposed Regulations. Particular emphasis would be placed on the new emissions standards and reporting requirements. All compliance promotion activities would be adjusted according to compliance analyses or if unforeseen compliance challenges arise.
Enforcement: The federal government would incur incremental costs related to training, inspections, investigations, and measures to deal with any alleged violations. With respect to enforcement costs, a one-time present value amount of $150,000 would be required for the training of enforcement officers and to meet information management requirements. The total present value of enforcement costs over the period are estimated to be about $605,000, comprising the costs of inspections (which include operation and maintenance costs, transportation and sampling costs), investigations, measures to deal with alleged violations (including warnings, environmental protection compliance orders and injunctions) and prosecutions.
Regulatory administration: Government administration costs are expected to be incurred by the Government in order to develop reporting infrastructure and to support submissions on an ongoing basis. The present value of administrative costs is estimated at approximately $533,000.
6.4 Summary of benefits and costs — Cement
Table 29 below summarizes the benefits and costs of the proposed performance standard for the cement sector.
| Incremental costs and benefits | 2014–2020 | 2021–2025 | 2026–2030 | 2031–2035 | Total 2014–2035 (Present Value) Discounted |
|---|---|---|---|---|---|
| Undiscounted | |||||
| A. Quantified impacts ($ millions) Benefits to Canadians |
|||||
| Environmental benefits (agriculture, soiling, visibility) | 8.5 | 11.4 | 12.2 | 13.1 | 30.8 |
| GHG benefits | N/A | N/A | N/A | N/A | N/A |
| Health benefits | 314.3 | 503.4 | 626.2 | 749.0 | 1,456.0 |
| Total benefits | 322.7 | 514.7 | 638.4 | 762.1 | 1,486.8 |
| Costs to industry | |||||
| Capital costs | 8.1 | 0 | 0 | 0 | 7.3 |
| Operating costs | 10.9 | 13.1 | 13.1 | 13.1 | 34.8 |
| Subtotal | 19.0 | 13.1 | 13.1 | 13.1 | 42.1 |
| Costs to Government | |||||
| Compliance promotion, enforcement and regulatory administration | 0.7 | 0.3 | 0.3 | 0.3 | 1.2 |
| Total costs | 19.8 | 13.5 | 13.5 | 13.5 | 43.4 |
| Net benefits | 302.9 | 501.3 | 625.0 | 748.6 | 1,443.4 |
| Benefit-to-cost ratio | 16.4 | 38.3 | 47.6 | 56.7 | 34.4 |
| B. Quantified impacts, non-monetized — e.g. from a risk assessment | |||||
| Reduction in SO2 (kt) | 20 | 25 | 25 | 26 | 96 |
| Reduction in NOx (kt) | 12 | 16 | 17 | 17 | 63 |
Note 5*
All numbers are undiscounted except for total (present value) numbers, which are discounted to 2013 using a 3% discount rate.
Note: Administrative costs for industry are not shown because they are in an order of magnitude lower than other costs (total present value is about $15,000).
7. Uncertainty and sensitivity analysis
7.1 Engines
Sensitivity analysis was undertaken by applying changes to key variables used in the analysis. Net benefits remain positive for the range of variables considered (each is discussed in turn below).
A discount rate of 3% is used in the analysis. If a 7% discount rate is used, net benefits would decrease to $3.6 billion.
The analysis assumes a natural gas fuel price of $4/MMBtu for the operation of the engines. In the sensitivity analysis, net benefits decrease by $78 million when the fuel price decreases by 30% or increase by $26 million (0.4%) when the fuel price increases by 30%. The largest fuel savings benefits are expected later in the period of analysis.
The sensitivity analysis also considers different capital costs for each engine model replacement or retrofit option. Also, the difference in cost between the replacement of engines that reach their end of life with new engines, compared to the cost of replacement with surplus engines, may be higher. Consequently, capital costs are varied by more or less 50%; net benefits decrease by $102 million or increase by $102 million, respectively.
Similarly, the analysis applies different annual maintenance and fuel costs depending on the characteristics of each engine model and/or retrofit option. In the case where maintenance costs vary by more or less 30%, net benefits increase or decrease by $57 million. In the case where fuel saved varies by more or less 30%, net benefits in terms of fuel expenditure increase or decrease by $67 million.
If all engines were to last 60 years, net benefits would increase by $247 million. If all engines lasted only 20 years, net benefits would decrease by $257 million.
A summary of the sensitivity analysis is presented in Table 30.
| Sensitivity variables | Net Present Value | ||
|---|---|---|---|
| Lower | Central | Upper | |
| Discount rate: Undiscounted, 7% | 10,613 | 6,491 | 3,633 |
| Natural gas price: -30%, +30% | 6,412 | 6,491 | 6,517 |
| Capital cost: -50%, +50% | 6,389 | 6,491 | 6,593 |
| Maintenance cost: -30%, +30% | 6,548 | 6,491 | 6,434 |
| Net quantity of fuel saved: -30%, +30% | 6,424 | 6,491 | 6,558 |
| Engine life: Lower: all engines last 20 years Upper: all engines last 60 years |
6,234 | 6,491 | 6,737 |
Note: Present value in 2012 dollars (millions). Discounted at 3% to base year 2013.
7.2 Boilers and heaters
Sensitivity analysis was conducted by varying the value of several key parameters in order to examine the effects on net benefits of changes in several key assumptions. Key parameters considered here are the capital cost per unit, the 40-year equipment life and the discount rate.
In the analysis, approximately $74,000 (or about 4% of the cost of a conventional boiler without NOx controls) is assumed to represent the incremental capital cost attributable to the Regulations. Table 31 below presents alternative costs assuming more or less 30% of the assumed value.
| Sensitivity variables | Present Value | ||
|---|---|---|---|
| -30 % | Central | +30 % | |
| Net benefits | 1,147.6 | 1,132.9 | 1,119.0 |
The analysis assumes a 40-year equipment life, which resulted in 57 (of 828) original boilers that would be subject to performance standards in 2026 or 2036 being replaced prior to the respective compliance dates for original equipment. Table 32 depicts the impact of assuming a 30- or 50-year equipment life in terms of the number of retrofits required and cost per unit.
| Sensitivity variables | Present Value | ||
|---|---|---|---|
| 30 years | 40 years | 50 years | |
| Number of boilers that would be replaced at end of useful life | 615 | 468 | 259 |
| Number of boilers that would be retrofitted due to Regulations | 0 | 0 | 23 |
| Number of new modern boilers due to economic growth | 413 | 413 | 413 |
| Number of boilers replaced after 2035 (outside of period of analysis) | 213 | 360 | 546 |
| Present value of capital cost ($/unit) | 49,218 | 54,025 | 51,362 |
As shown above, a longer equipment life implies that a small number of units (23) would be retrofitted to upgrade their burners on an original older boiler. Nonetheless, the impact on capital costs and the overall NPV over the period is low relative to the net benefits.
The sensitivity analysis of alternative discount rates is presented in Table 33 below.
| Sensitivity variables | Net Present Value | ||
|---|---|---|---|
| Lower (undiscounted) |
Central (3%) |
Upper (7%) |
|
| Net benefit | 1,785.0 | 1,132.9 | 651.6 |
7.3 Cement
A sensitivity analysis was conducted by varying the value of several key parameters in order to examine the effects on net benefits of changes in several key assumptions. The variable that has the largest impact on net benefits is the discount rate. In addition, given that the present value of benefits (discounted at 3%) is more than 30 times higher than costs, there is a high level of confidence that the cost-benefit analysis would still be positive even if benefits were largely overestimated. Undiscounted results as well as results discounted with a 7% discount rate are presented in Table 34 below.
| Sensitivity variables | Net Present Value | ||
|---|---|---|---|
| Undiscounted | Central (3%) | 7% | |
| Discount rate | 2,179 | 1,444 | 882 |
8. Distributional and competitiveness impacts
Generally, with respect to the competitiveness impacts of the proposed performance standards, consideration was given to the ability of the sector and affected firms to absorb costs (given profit margins and competitive pressures) or pass on costs to consumers (through higher product prices) given the size of the estimated costs.
8.1 Engines
The estimated compliance cost impacts associated with the proposed performance standards for engines are expected to be distributed across sectors as follows: upstream oil and gas (88%) and natural gas transmission pipeline (12%). In line with the sector impacts, estimated costs are expected to be distributed across the country as follows: British Columbia (-5%, due to fuel savings), Alberta (86%), Saskatchewan (8%), Manitoba (<1%), Ontario (3%), Newfoundland and Labrador (7%), and Nova Scotia (<1%). Although benefits are expected to occur in all provinces and territories, the largest share of benefits will occur in Alberta.
The magnitude of the estimated costs associated with the proposed performance standards is expected to be small. For modern engines, the Regulations are in line with current U.S. EPA regulations. Overall, the estimated average annual cost of the proposed performance standards over the period would represent a small increase relative to sector-wide oil and gas net cash expenditures, (e.g. less than a 0.05% increase relative to 2011 expenditures), (see footnote 43) though costs would vary across affected firms. The requirements for original engines would be expected to achieve significant reductions in NOx and to result in fuel and maintenance savings for some operators. For original engines, the proposed performance standards provide significant flexibility in both implementation and timing; the requirements would include the ability for firms to comply through a fleet average calculation option and the most stringent emissions limit for original engines would not come into effect until 11 years after implementation. These provisions would reduce the potential for stranded capital and allow firms to plan compliance into maintenance and investment schedules.
The competitive positions of the sectors that would be affected by the proposed performance standards are varied, and firms within each sector have different capacities to respond to regulatory costs. The upstream oil and gas sector and the firms within it are generally price takers and would not be able to pass on costs to consumers. While upstream natural gas is currently facing competitive pressures as a result of lower natural gas prices due to increased shale gas production in the United States, and given the flexibility and minimal costs associated with the proposed performance standards, it is expected that the competitive position of firms within this sector would not change. As the natural gas transmission pipeline sector is a regulated monopoly, there may be some ability for firms in the sector to pass on regulatory costs, though the impact is not expected to be material given the small magnitude of the costs and the flexibility associated with the proposed performance standards.
8.2 Boilers and heaters
The estimated compliance cost impacts associated with the proposed performance standards for boilers and heaters are expected to be distributed across sectors as follows: oil sands (48%), pulp and paper (21%), chemicals (17%), upstream oil and gas (7%), and base metal smelting sectors (5%). In line with the sector impacts, estimated costs are expected to be distributed across the country as follows: Alberta (66%), British Columbia (5%), Ontario (13%), Quebec (13%), New Brunswick (1%), and Saskatchewan (1%). All provinces and territories are expected to benefit from the proposed performance standards; however, the largest shares of benefits are expected to be realized in Ontario, Quebec, and Alberta.
The magnitude of the estimated compliance costs is expected to be small, given the design of the proposed performance standards. For modern units, the incremental investment required would be small relative to the cost of the unit itself. Firms owning original units that would need to be modified to meet the emission requirements (i.e. those that are high emitters and likely have no NOx emission controls) would be given a lead time to comply of up to 20 years, meaning that firms would be able to align investments with capital turnover cycles. The fuel composition, boiler efficiency, and the use of air preheat for heaters were also considered in specifying the emission intensity requirements. Further, the proposed Regulations are comparable to the requirements for similar equipment in many states in the United States.
The competitive positions of the sectors that would be affected by the proposed performance standards are varied, and firms within each sector have different capacities to respond to regulatory costs. Generally, the sectors under consideration are price takers. Some, such as upstream natural gas and pulp and paper are currently facing competitive pressures. Nonetheless, given the lead time, flexibility, and minimal costs associated with the proposed performance standards, it is expected that the competitive position of firms within these sectors would not change as a result of the proposed performance standards. As mentioned above, the incremental cost of LNB technology per unit used in this analysis is estimated at $74,000 (or approximately 4% greater than the capital cost of an entire new conventional boiler). On an annual basis, and taking operating costs into account, this would represent less than a 0.5% cost increase relative to the average annual cost of a non-compliant unit. (see footnote 44) Moreover, it is not until 2026 that the first original units would be required to be replaced or retrofitted.
8.3 Cement
The distribution of the estimated compliance cost impacts associated with the proposed performance standards for cement is as follows: 24% for eastern Canada, 47% for Ontario and 29% for western Canada regions. It is estimated that the proposed set of performance standards for the cement industry will result in significant benefits for all three regions (West, Ontario, and East).
Both inland producers and producers closer to marine ports (more exposed to international markets) are expected to be affected by the proposed performance standards. It is anticipated that inland producers may have some limited ability to pass on costs, while producers closer to marine ports would likely absorb costs. However, given the small magnitude of the estimated compliance costs, it is expected that any price increases would be minimal.
The estimated average annual cost (see footnote 45) of meeting the proposed performance standards would represent an approximate increase in production costs of 0.1ã1.5% at individually affected facilities, based on Statistics Canada data for production expenses. (see footnote 46)
ãOne-for-Oneã Rule
In addition to the effort regulatees would need to make to be in compliance with the performance standards in the proposed Regulations, certain administrative tasks would also need to take place. Environment Canada has estimated the resulting incremental administrative burden from the proposed Regulations. Overall, the calculations of administrative burden for each set of performance standards include planning, collecting, processing and reporting of information, completing forms, and retaining data required by the federal government to demonstrate compliance with the proposed Regulations. (see footnote 47)
The proposed Regulations are expected to result in a net increase in administrative burden; therefore, the regulatory initiative is considered an ãINã under the rule. Increases in burden in all sectors affected by each performance standard will take the form of, for example, reporting and record keeping requirements.
Following the Treasury Boardãs standard costing model, and using a 7% discount rate, (see footnote 48) the expected annualized administrative cost to all business subject to the proposed Regulations is approximately $142,447 (in 2012 Canadian dollars).
The requirements associated with each performance standard in the proposed Regulations are estimated to result in an annualized increase in administrative costs to all relevant businesses of approximately
- ãô $120,075 for engines (or $34 per small business, $94 per medium-large business, or $5,045 per very large business);
- ãô $21,135 for boilers and heaters (or between $14 and $23 per unit, depending on the existing provincial requirements and the type of reports submitted to the federal government); and
- ãô $1,237 for cement (or $82 per business).
Only incremental efforts are attributed to the proposed Regulations; therefore, estimates of administrative burden differ according to the existing reporting requirements at the provincial level.
For all sector/equipment groups, the estimates of administrative burden include learning about the administrative requirement (1 hour). Additional components specific to each sector/ equipment group are as follows. (see footnote 49)
(a) Engines
One-time costs
- Preparing, approving, and submitting information for original engines for inclusion in the engine registry for original engines (1 hour per company, plus 0.2 hours per original engine greater than 250 kW);
- Recording and reporting baseline test results for original engines (0.35 hours per baseline test);
- Notifying the Minister of the Environment if electing to use fleet averaging (0.5 hours per company); and
- Submitting the assigned emission value for original engines in the engine registry if electing to use fleet averaging (0.25 hours per original engine greater than 250 kW).
Ongoing costs
- Updating the engine registry if changes occur (0.25 hours per update; 2.7% of original engines are replaced annually and 5% of original engines require updates);
- Registering replacement units or replacement modern engines if electing to use fleet averaging (0.25 hours per registration; 2% of the original engines are replaced by these units or modern engines annually);
- Preparing and submitting an annual report (0.25 hours per company, 0.25 hours per test, 0.25 hours per low-use engine to retrieve operating hours; low-use engines account for 5% of the engines covered); and
- Record-keeping (0.1 hours per test, 0.1 to 0.35 hours per engine covered and, if electing to use the fleet averaging, 0.25 hours per company plus 0.1 hours per original engine greater than 250 kW).
(b) Boilers and heaters
- Preparing and submitting the initial report for original units and modern units, depending upon existing provincial requirements (retrieving data, reviewing and approving the report, and submitting the report)
- a.ô for original units in Alberta and Quebec: 3 hours for class 70 and class 80 units, and 2 hours for other units;
- b.ô for original units in other provinces: 5 hours for class 70 and class 80 units, and 3 hours for other than class 70 and class 80 units; and
- c.ô for modern units in Alberta and Quebec: 3.5 hours; for those in other provinces: 5.5 hours.
- Preparing and submitting the annual report (retrieving data, reviewing and approving the report, and submitting the report): 2 hours.
- Updating data if a unit switches to alternative gaseous fuel: 2 hours.
(c) Cement
- Preparing and submitting report: 2 hours.
- a.ô This step includes retrieving data, reviewing and approving the report, and submitting the report.
- Record keeping: 0.5 hours.
These new costs will require equal and off-setting administrative cost reduction to existing regulations, and as these are new Regulations, Environment Canada will also be required to repeal at least one existing Regulations within two years.
Small business lens
The purpose of the small business lens is to drive better analysis of small business realities and consultation at the earliest stages of regulatory design, and to consider flexible compliance approaches that minimize costs for small businesses operating in Canada.
a. Engines
At this time, based on industry databases and two separate rounds of outreach to small businesses in the oil and gas sector, Environment Canada estimates that there are a total of 280 businesses that operate engines and could be classified as small businesses (annual net revenue of $30,000ã$5 million). In addition, Environment Canada further estimates that these companies operate 2 engines on average, for a total of 560 engines, which represents less than 10% of the total number of original engines subject to the proposed Regulations. (see footnote 50) These are rough estimates, and it is likely that the number of companies in the sector and the number of engines each company operates is actually lower.
- Regulatory flexibility analysis
A fleet average approach to address emissions from original engines is proposed. As a result, in an operator or ownerãs fleet, some engines would emit more than the fleet average and their emissions would not be required to be controlled because other engines would emit less than the fleet average. Additional reporting, record-keeping and compliance requirements are associated with this option, because a fleet average requires more verification and calculation to ensure that the intended environmental outcomes are reached. For example, an hour meter must be installed on each engine, and the operating hours and the calculation of the fleet average must be reported each year.
A second regulatory option, the flat limit option, is also available, and is aimed mainly at small businesses that are expected to operate fewer engines. This option was added based on the recognition that the fleet average approach requires additional administrative reporting, but offers no compliance benefits to small businesses with few engines. The flexibility of two approaches provides a measure of administrative burden relief to small businesses.
The flat limit option requires 50% of an operatorãs original fleet to emit less than 4 g/kWh by 2021, and 100% of the original fleet to emit less than 4 g/kWh by 2026. Given that this option is enforceable on a per-engine basis by conducting a performance test to verify compliance, less reporting and record-keeping are required.
The flat limit option replaced the fleet average as the default option in order to decrease administrative burden; small businesses will not need to send a notice to the Minister to indicate their choice of using the flat limit. Regulatees that elect to use the fleet average must send a notice to the Minister.
Table 35 below compares the administrative and compliance costs of both regulatory options for small businesses.
| Flat Limit (Flexible Option) |
Fleet Averaging (Original Option) |
|||
|---|---|---|---|---|
| Short description |
|
|
||
| Number of small businesses | 280 | 280 | ||
| Compliance costs | Annualized Average ($) | Present Value ($) | Annualized Average ($) | Present Value ($) |
| Capital costs | 1,714,251 | 33,600,000 | 1,714,251 | 33,600,000 |
| Operation, maintenance and testing costs | 6,228,453 | 153,391,455 | 6,228,453 | 153,391,455 |
| Costs relating to calculation | 638 | 13,650 | 17,000 | 350,019 |
| Administrative costs | ||||
| 9,841 | 234,054 | 12,504 | 297,245 | |
| Total costs (all small businesses) | 7,953,183 | 187,239,159 | 7,972,208 | 187,638,719 |
| Total cost per small business | 28,404 | 668,711 | 28,472 | 670,138 |
| Risk considerations | No risk | No risk | ||
Note: Costs have been estimated using the Standard Cost Model, using 2012 Canadian dollars, and a 21-year time horizon using a 3% discount rate. Detailed calculations are available upon request.
Table 35 demonstrates that, per business, administrative costs under the flat limit option are 21% lower than under the fleet averaging option. Coupled with marginally smaller compliance costs, the flat limit option imposes an estimated $28,404 in annualized costs on small businesses, while the fleet averaging option imposes an estimated $28,472 in annualized costs. This amounts to a total savings of $19,025 for all small businesses over the period ($1,427 per business, or $68 per business annualized). As a result, the flat limit option is recommended for small businesses.
- Further consideration of flexible options
In addition to reducing administrative costs for small businesses, Environment Canada is also proposing an exemption from the requirements for original engines for small businesses.
Environment Canada reached out to the small business community during consultations in the fall of 2012 and the spring of 2013. Environment Canada has also spoken with industry associations representing both large and small businesses in the oil and gas sectors. The associations were unable to provide the company-level information needed to decide what threshold to set to exempt small businesses from compliance and indicated that small businesses would likely only provide information once draft Regulations were published.
Between this publication and the final publication in the Canada Gazette, Part II, Environment Canada will seek to directly engage small businesses through consultations to introduce workable options to reduce the burden on small business.
b. Boilers and heaters
For boilers and heaters, the proposed Regulations include an emission threshold to include only boilers and heaters with a rated capacity greater than 10.5 GJi/hr. It is expected that this size threshold would exclude all small businesses using boilers and heaters.
c. Cement
All cement manufacturing facilities in Canada are either entirely or partially owned and operated by large, multinational firms. Therefore, the proposed Regulations would not impose any level of direct compliance cost and/or administrative cost on small businesses.
Consultation
Stakeholders have been engaged extensively in the development of a new air quality management system for many years. Between April and December 2007, following the publication of the Turning the Corner plan, a series of targeted meetings were held with provincial/territorial governments, NGOs and with industrial sectors. In 2008, once federal officials started developing an alternative framework in collaboration with stakeholders and provinces, work sessions (teleconferences and face-to-face meetings) focused on the various possible key components that would be included.
Thirteen working groups with provincial, territorial and stakeholder representatives developed preliminary industrial emission requirements for each of the affected sectors through a consensus-based decision-making process. More than 300 representatives from provincial governments, industry and non-governmental organizations participated with federal officials in the development of a new Comprehensive Air Management System over two years.
In 2010, a new process was launched to clarify and decide upon several jurisdictional and legal issues. Many multi-stakeholder working groups continued, including the BLIERs working groups, to flesh out more details. At the end of this process, in early 2012, a more refined AQMS was the result of extensive collaborative, consensus-based processes.
Several prominent national environmental and health non-governmental organizations were involved in the development of the AQMS and have supported the creation of federal regulations. However, not all NGOs are supportive of the base level nature of the BLIERs, and in working group discussions, were often in favour of more stringent performance standards.
After March 2012, the BLIERs working groups were dissolved and Environment Canada began pre-regulatory technical discussions with provinces, territories and potential regulatees on the issues related to the implementation of the BLIERs. In some cases, non-governmental organizations were invited to participate in these activities. In addition, Environment Canada informed members of the Environmental Planning and Protection Committee of the Canadian Council of Ministers of the Environment (CCME) of progress on the proposed Regulations and on the concept that most of the BLIERs requirements will be included in one set of regulations.
The provinces and territories, with the exception of Quebec, are supportive of the proposed Regulations because the federal government is developing them in the most transparent way possible and writing them to minimize duplication in testing, reporting and enforcement. Quebec supports the general objectives of the AQMS and will collaborate with jurisdictions to implement the local and regional air quality management element.
Overall, concerns about overlap and/or duplication with provincial regulations, as well as administrative burden more generally, have been addressed in the following ways:
- ãô Where requirements differ, regulatees are able to apply to use existing provincial testing requirements in place of those identified in the proposed Regulations;
- ãô Information requested in the proposed Regulations is limited to the minimum amount required to determine compliance;
- ãô Where applicable, single-reporting measures for federal and provincial requirements will be put in place; and
- ãô Although inspections currently take place in coordination with provincial enforcement officers at times, Environment Canada will look into the possibility of further coordinating inspections with provincial enforcement officers.
Consultations specific to each BLIER with provincial and territorial governments, industry, and non-governmental organizations are discussed below.
a. Engines
The consultation process for the engine requirements of the proposed Regulations began in the fall of 2009, as part of the initial BLIER development for upstream oil and gas NOx sources. The engine expert working group was formed in early 2011. Representatives from the upstream oil and gas and natural gas transmission pipeline industries, provinces, other government departments, environmental non-governmental organizations (ENGOS), engine and emission control technology manufacturers/retailers and emissions testing companies met regularly to discuss technical issues and share information about different emission limits for modern and original engines. For modern engines, at the end of that process, there was general agreement on the broad elements with the exception of the phased-in limit. While Environment Canada and ENGOs supported alignment with the NOx limit of 1.3 g/kWh after a three-year period, as implemented in 2010 by the U.S. EPA, provinces and industry were of the view that the less stringent limit of 2.7 g/kWh was more appropriate.
For original engines, a consensus was not reached. Alberta, Environment Canada and ENGOs proposed engine limits ranging from 2.7 g/kWh to 4.0 g/kWh. The natural gas transmission pipeline sector proposed a fleet average and the oil and gas sector proposed to apply a standard of 4.0 g/kWh to relocated engines. In parallel with the extended expert working group meetings in early 2012, Environment Canada met with representatives from the provinces of British Columbia, Alberta, Saskatchewan and Ontario. Federal government officials and provincial participants agreed in principle to a fleet average approach with the emission limit at 4.0 g/kWh, to address NOx emissions from original engines. This agreement in principle was not completed in time to present to the extended expert working group and for an agreement to be reached; nonetheless, it became the basis of the proposed Regulations.
After March 2012, the pre-regulatory discussions began focusing on implementation details. In August 2012, a first working document was distributed by Environment Canada, and consultations were held in the following month. More than 1 000 stakeholders were invited to participate in these consultations, including previous BLIERs process participants (ENGOs, provincial representatives and affected industrial sectors), other companies identified using an upstream oil and gas database, and industry associations. Over 70 individuals attended the information sessions outlining the contents of the first working document distributed, and attendees were invited to provide written comments by October 2012.
Stakeholder concerns can be loosely grouped into four main categories. These categories and how they were addressed are as follows:
- Three-year phase-in of 1.3 g/kWh limit for modern engines: The original working document had proposed an initial limit of 2.7 g/kWh and after a three-year period reduced this limit to 1.3 g/kWh. Stakeholders were concerned about the lack of evidence indicating that engines were capable of achieving this limit in Canadian circumstances, particularly under field conditions using unprocessed gas. Environment Canada has modified the requirements such that, at this time, there is no longer a requirement to meet the 1.3 g/kWh limit. This modification recognizes the difficulty of meeting a limit of 1.3 g/kWh while still achieving significant environmental benefits compared to current engine regulations in much of Canada.
- Lack of sampling port and additional reference methods: Industry stakeholders raised concerns that the requirements regarding the location of the sampling ports outlined in the working document would be costly when applied to original engines because they would require the installation of a sampling port conforming with the reference methods as well as a platform to have access to it. A sampling port, or a hole in the exhaust manifold where a probe may be inserted, conforms to the reference methods if it is located far enough from any flow disturbance. Environment Canada agreed with this concern, and developed an exception for original engines complying with the limit in terms of ppmv. For these engines, the test could now be conducted at any location in the exhaust manifold. For emissions measured in terms of ppmv, this exception does not compromise accuracy. Environment Canada also added additional reference methods for the measurement of NOx as requested by industry stakeholders to provide more options.
- Excessive administrative requirements: Industry stakeholders provided comments indicating that the Regulations should not require reporting, but that companies should be required to maintain records which could be audited. Environment Canada is of the view that reporting is an important component of regulatory compliance assurance and enforcement. However, the reporting requirements were significantly streamlined to ensure that a minimum of information was being asked from industry while still providing the information required to determine compliance. For example, test results and updates to the engine registry are no longer submitted 60 days or 30 days after a test or a change has occurred, but only once a year, at the same time as the annual report. As requested by industry, surplus engines will not have to be registered and the reporting date has been delayed from April 1 to July 1.
- Excessive testing requirements: A number of stakeholders felt that the frequency at which testing was required was excessive and recommended to test 10% of the engines annually. Environment Canada had based the testing frequency on a review of requirements from other jurisdictions and an engineãs capability to maintain an emission level. Environment Canada has decreased the testing frequency for rich-burn engines from every four months to every six months. Also, the testing of original lean-burn engines has been significantly simplified for those subject to the flat limit or those using default emissions values of 4 g/kWh for the fleet average. Now, instead of a complete performance test, an O2 measurement is requested annually.
The changes outlined above, and others, were incorporated into a second working document which was distributed to stakeholders for information purposes in January 2013. Comments on the second version were received from two industry associations and some further changes were made to the proposed Regulations, mainly to clarify definitions, to define what happens in the case of engines having more than one responsible person and to give the option to calculate the fleet average in the units of their choice (ppmv or g/kWh).
b. Boilers and heaters
The consultation process for the non-utility boiler and heater requirements within the proposed Regulations began in the fall of 2009 and continued again beginning in February 2011, when a boilers and heaters expert group was formed. Representatives from Environment Canada, affected industries, other jurisdictions, other federal government departments, manufacturers and non-governmental organizations met regularly to present their interests and concerns, to share new information on existing proposals and to advance new proposals. At the end of that process, in March 2012, there was general agreement on the broad elements of the process (e.g. the overall approach using CCME guidelines as a starting point, and the emissions limits for medium-sized and new equipment). However, there was not a consensus recommendation on the performance standards for large new equipment. Also, various implementation issues emerged that would be dealt with in the regulatory development process, (e.g. potential duplication and reporting requirements).
After March 2012, the pre-regulatory discussions began, focusing on implementation details. Over 300 stakeholders were invited to participate in these consultations. Over 50 representatives from provincial and territorial governments, owner/operators of boilers and heaters in the AQMS industrial sectors, industry associations, manufacturers, installers, provincial authorities that provide installation permits for boilers, and environmental non-governmental organizations participated actively in the consultations.
Over 70 sets of comments were received. Significant concerns were raised in the following areas, and changes where appropriate were made, as outlined below:
- The potential for double regulation: This was a factor in determining whether specific equipment would be subject to the Regulations (e.g. reheat furnaces in the iron and steel sector are expected to be regulated in the future and so are excluded from the proposed Regulations).
- Uncertainty about the applicability of the Regulations to specialized equipment: Each case was considered separately, and a decision to include or exclude specific equipment was made based on such factors as the technical difficulty of applying the emission limit, or whether the equipment would be subject to another regulatory instrument. For example, duct burners, while technically heaters, were excluded because they are an integral part of a turbine system, which would be subject to another regulatory instrument.
- Harmonization with existing requirements: Current provincial requirements were considered when defining measurement procedures. The proposed Regulations include a mechanism for regulatees to apply to have existing methods required by provinces approved for demonstrating compliance with the proposed federal Regulations (e.g. regarding CEMS data gathering procedures).
c. Cement
The consultation process for the requirement for the cement manufacturing sector in the proposed Regulations began in the fall of 2009. A cement expert working group was formed in February 2011 and included representation from Environment Canada, other federal departments, provinces, the Cement Association of Canada (CAC), industry, and the ENGO communities. The combination of teleconferences and face-to-face meetings provided a forum to share and validate information, to flag concerns, and to discuss proposals. At the end of that process, there was general agreement on the broad elements, including pollutants of concern, the performance standards for each of the pollutants, and monitoring and reporting requirements. Although ENGO representatives were involved in the development of the BLIERs, they were supportive of more stringent performance standards.
In July 2012, further consultations were initiated to solicit input from stakeholders on implementation concerns. All stakeholders engaged in the previous phase were invited to participate. The CAC, industry and the provinces actively participated by reviewing and providing comments on consultation documents. Based on comments received, consideration was given and the appropriate changes were made, as outlined below:
- Definitions: In the development of definitions, technical elements were taken into consideration and definitions were adjusted accordingly in order to enhance the clarity of several elements and to better harmonize with existing definitions. The adjustments to the definitions were consistent with efforts to minimize administrative burden.
- Acceptable protocols and reporting elements: Monitoring and reporting requirements were amended to better align with existing regulatory provisions in order to minimize administrative burden and to better harmonize with existing reporting and monitoring requirements. In addition, the proposed Regulations include a mechanism for regulatees to apply to have the existing methods required by provinces approved for demonstrating compliance with the proposed federal Regulations.
In general, the provinces, industry representatives and the CAC continue to be supportive of the performance standards and a regulatory approach.
d. Common elements
In addition, as the proposed Regulations will apply to all of the sectors covered by the AQMS, provinces, territories, and industry stakeholders were sent information on the elements that would be common to all, including such aspects as definitions and reporting requirements. Environment Canada addressed the following common types of questions received either through telephone calls or by email. In response to questions about how federal and provincial reporting and testing requirements would be coordinated, the federal government assured stakeholders that an integral aspect of the BLIERs was to align reporting and testing requirements between governments to the extent possible in order to reduce the burden on industry. There were also questions about duplication of compliance assessment and enforcement activities. Environment Canada confirmed that regulatees are assessed for compliance, and enforcement will take place as required. However, the federal government has also expressed openness to establishing equivalency agreements with provinces that meet the necessary criteria, as this would avoid duplication of compliance assessment and enforcement activities.
Regulatory cooperation
The collaborative work done on developing both the Comprehensive Air Management System and the AQMS, as well as the following discussion through committees under the Canadian Council of Ministers of the Environment, has put provinces and territories more at ease with respect to the federal approach for these proposed Regulations. Implementation of the system is strongly supported by provinces and territories, which see it as a model of effective federal/provincial cooperation where each level of government takes distinct actions, within its authority that are coordinated and mutually reinforcing.
The Government of Canada extensively engaged provinces and territories during the regulatory development process (conference calls, sharing of information, etc.) in order to better understand their perspectives on the proposed Regulations and the relationship with existing actions on the industries in their jurisdiction.
Under the AQMS, provinces are to create or update their existing requirements (if necessary) to the levels of the performance standards. To minimize overlap with existing and/or new provincial requirements, the proposed Regulations have been designed to initially assess compliance over a two-year period for the cement sector. For the equipment-based performance standards, the federal government would delay the compliance date by one year from the date agreed upon by stakeholders during the development of the performance standards. In this way, provinces that have requirements that achieve a comparable environmental outcome will be the front-line regulators and have the first opportunity to bring facilities into compliance. In addition, the proposed Regulations have been written to reduce duplication of reporting and monitoring, by asking potential regulatees, where possible, to generate information in a manner similar to what provinces currently require.
The proposed Regulations would introduce new requirements in some provinces and territories. The federal government is open to pursuing equivalency agreements with interested provinces and territories.
The implementation of the proposed Regulations is not expected to affect trade. The performance standards are benchmarked to emissions standards that are considered good performance where air pollution is not an issue. In many cases, the benchmarks were existing Canadian, U.S., or European requirements for similar facilities, equipment or sectors.
The proposed Regulations would enable regulatory alignment with the United States under the Canada-United States Regulatory Cooperation Council Joint Action Plan, under which both Canada and the United States will be required to have regulatory approaches in place that address emissions of particulate matter and its precursor pollutants. The proposed Regulations are also deemed essential for continued engagement with the United States on transboundary flows of air pollution through the Canada-United States Air Quality Agreement.
In terms of the economic analysis of the proposed Regulations, in order to engage provinces and territories prior to publication of the Regulatory Impact Analysis Statement (RIAS) in the Canada Gazette, Part I, Environment Canada established a new cost-benefit analysis working group (CBAWG) in December 2012. Through the CBAWG, the federal government has shared detailed information about modelling approaches as well as data and assumptions employed in the analysis of the proposed Regulations. A set of detailed documents outlining the proposed CBA methodology for each set of performance standards was shared with provinces and territories. These methodology documents included cost estimates by technology, as well as information on key assumptions that were used to develop the total cost estimates applicable to a given sector or equipment group.
Rationale
Although progress has been made in reducing some air pollutant emissions, air quality remains an ongoing issue in Canada and presents a significant risk to the health of Canadians every day. Negative health effects are experienced at even low levels of concentrations of air pollutants. Air pollution is linked to cardiovascular and respiratory illnesses such as heart disease, stroke, asthma, and bronchitis, and even premature death. There is also growing evidence that air pollution may be associated with other health impacts, such as low birth weight and various neurological effects. Moreover, air pollutants affect overall ecosystem health, including crop yields. All of these impacts lead to significant costs for the health care system and the economy, and for Canadians more broadly.
Despite significant initiatives to reduce emissions from vehicles, engines and fuels, and consumer and commercial products, air pollution is still an issue of concern in Canada.
The lack of a clear national approach for managing air pollution from industrial sources has led to widely inconsistent industrial emission standards across the country. The BLIERs overall, and the proposed Regulations as an initial step, would reduce inconsistencies across Canada by ensuring that all facilities across Canada are subject to the same base-level requirements. Furthermore, the proposed Regulations would improve peopleãs lives by reducing air pollutant emissions, particularly where there have been few requirements for emission abatement in the past, and would bring Canada closer to achieving the updated CAAQS.
A regulatory approach was chosen for engines, boilers and heaters and cement because it is a cost-effective way to ensure consistency and fairness. Moreover, it is broadly supported by industry as it provides policy certainty and is sensitive to industry costs and competitiveness concerns. Implementation of the system is supported by provinces, which see it as a model of effective federal/provincial cooperation where each level of government takes distinct, coordinated actions within their authorities that are mutually reinforcing. Other key stakeholders, such as several major health and environmental non-governmental organizations, are also supportive.
In addition, the proposed Regulations would reduce transboundary pollution flows from Canada to the United States and would also strengthen Canadaãs position in discussions with the United States to further reduce transboundary air pollution under the Canada-United States Air Quality Agreement.
The proposed Regulations would result in significant net health and environmental benefits. It is expected that they will lead to a total reduction of approximately 2 065 kt of NOx and 96 kt of SO2 between 2013 and 2035, reducing adverse health and environmental effects from the atmospheric formation of ozone and particulate matter. For engines alone, the net incremental benefit of achieving the NOx reductions attributable to that performance standard is $6.5 billion. Similarly, for boilers and heaters, the net incremental benefit is $1.1 billion, and for cement, the net incremental benefit is $1.4 billion.
As per a Cabinet Directive, a preliminary Strategic Environmental Assessment was conducted, and also confirmed that the proposed Regulations would have a positive impact on air quality and the environment overall.
Implementation, enforcement and service standards
Compliance strategy
Compliance promotion activities are intended to assist the regulated community to achieve compliance. These activities are targeted at raising awareness and assisting the regulated community to achieve a high level of overall compliance as early as possible during the regulatory implementation process. The regulatees and other stakeholders would be well positioned to understand that the Regulations are coming, what would be regulated and what compliance with the Regulations would entail.
Compliance promotion activities could include
- mailing out of the final Regulations;
- developing and distributing promotional materials (e.g. fact sheets, Web material);
- upon request, distributing additional information, industry-specific information or focused information regionally in a tailored approach at a later time;
- advertising in trade and association magazines;
- attending trade association conferences; and
- presenting workshops/information sessions to explain the proposed Regulations.
Particular emphasis would be placed on the new emissions standards and reporting requirements, and on explaining these activities to small- and medium-sized enterprises. Efforts would also include responding to and tracking inquiries in addition to contributing to the compliance promotion database. As the regulated community becomes more familiar with the requirements of the proposed Regulations, these activities are expected to decline to a maintenance level. The compliance promotion activities would be adjusted according to compliance analyses or if unforeseen compliance challenges arise.
Preliminary assessments of compliance with the proposed Regulations will be carried out through review and analysis of reports submitted, and may require follow-up with regulatees.
Enforcement
The proposed Regulations are made under CEPA 1999, so enforcement officers will, when verifying compliance with the proposed Regulations, apply the Compliance and Enforcement Policy for CEPA 1999. (see footnote 51) This Policy sets out the range of possible responses to alleged violations, including warnings, directions, environmental protection compliance orders, tickets, ministerial orders, injunctions, prosecution and environmental protection alternative measures (which are an alternative to a court prosecution after the laying of charges for a CEPA 1999 violation). In addition, the Policy explains when Environment Canada will resort to civil suits by the Crown for cost recovery.
To verify compliance, enforcement officers may carry out an inspection. An inspection may identify an alleged violation, and alleged violations may also be identified by Environment Canadaãs technical personnel, through information transmitted to the Department by the Canada Border Services Agency or through complaints received from the public. Whenever a possible violation of the Regulations is identified, enforcement officers may carry out investigations. In developing enforcement plans for the Regulations, EC will look into the possibility of further coordinating inspections with provincial enforcement officers.
When, following an inspection or an investigation, an enforcement officer discovers an alleged violation, the officer will choose the appropriate enforcement action based on the following factors:
- Nature of the alleged violation: This includes consideration of the damage, the intent of the alleged violator, whether it is a repeat violation, and whether an attempt has been made to conceal information or otherwise subvert the objectives and requirements of CEPA 1999;
- Effectiveness in achieving the desired result with the alleged violator: The desired result is compliance within the shortest possible time and with no further repetition of the violation. Factors to be considered include the violatorãs history of compliance with the Act, willingness to cooperate with enforcement officers, and evidence of corrective action already taken; and
- Consistency: Enforcement officers will consider how similar situations have been handled in determining the measures to be taken to enforce the Act.
Performance measurement and evaluation
The Performance Measurement and Evaluation Plan (PMEP) describes the desired outcomes of the proposed Regulations and establishes indicators to assess the performance of the proposed Regulations in achieving these outcomes. The PMEP package (available upon request) is composed of three documents:
- the PMEP itself, which details the regulatory evaluation process;
- the logic model, which provides a simplified visual walk-through of the regulatory evaluation process; and
- the table of indicators, which lists clear performance indicators and associated targets, if applicable, in order to track the progress of each outcome of the proposed Regulations.
The three documents complement each other and allow the reader to gain a clear understanding of the outcomes of the proposed Regulations, the performance indicators, as well as the evaluation process.
Outcomes
The PMEP details the suite of outcomes as regulatees comply with the proposed Regulations. These outcomes include the following:
- Upon publication of the proposed Regulations, the regulated community will become aware of the proposed Regulations, modify practices and equipment and/or purchase equipment to comply with the Regulations and meet the reporting requirements, when applicable (immediate outcome).
- Through modified practices and investments in cleaner technology, regulated industrial sectors and equipment types will be in compliance with the proposed Regulations (intermediate outcomes).
- This will ultimately lead to reduced emissions from industrial sectors covered by the proposed Regulations (final outcome).
The proposed Regulations target new and existing industrial facilities and equipment types and may incorporate progressively more stringent standards depending on the sector. As a result, the outcomes, such as anticipated reductions in emissions, will take place progressively and accumulate over time as the regulated Canadian industrial sectors and equipment types are improved.
Performance indicators and evaluation
Detailed, quantitative indicators and targets, if applicable, were defined for each sector and equipment type. These will be tracked on an annual, biannual or five-year basis, depending on emissions. In addition, a compliance assessment will be conducted periodically to gauge the performance of every indicator against the identified targets. This regular review process will allow the Government of Canada to clearly detail the impact of the proposed Regulations on the industrial sectors and equipment types, and to evaluate the performance of the proposed Regulations in reaching the intended targets.
These performance indicators are available in the PMEP table of indicators. These indicators also allow the determination of whether regulatory performance is ãabove and beyondã compliance by examining changes in emissions from a BAU scenario.
Contacts
BLIERs policy:
Matt Jones
Director
Air Emissions Priorities Division
Environment Canada
Telephone: 819-420-7742
Email: cleanair-airpur@ec.gc.ca
Economic analysis:
Yves Bourassa
Director
Economic Analysis and Valuation Division
Environment Canada
Telephone: 819-953-7651
Email: RAVD.DARV@ec.gc.ca
Small Business Lens Checklist
1. Name of the sponsoring regulatory organization:
2. Title of the regulatory proposal:
3. Is the checklist submitted with a RIAS for the Canada Gazette, Part Ⅰ or Part Ⅱ?
![]() Canada Gazette, Part Ⅰ
Canada Gazette, Part Ⅰ
![]() Canada Gazette, Part Ⅱ
Canada Gazette, Part Ⅱ
| I | Communication and transparency | Yes | No | N/A |
|---|---|---|---|---|
| 1. | Are the proposed Regulations or requirements easily understandable in everyday language? | |||
| 2. | Is there a clear connection between the requirements and the purpose (or intent) of the proposed Regulations? | |||
| 3. | Will there be an implementation plan that includes communications and compliance promotion activities, that informs small business of a regulatory change and guides them on how to comply with it (e.g. information sessions, sample assessments, toolkits, Web sites)? | |||
| 4. | If new forms, reports or processes are introduced, are they consistent in appearance and format with other relevant government forms, reports or processes? | |||
| II | Simplification and streamlining | Yes | No | N/A |
| 1. | Will streamlined processes be put in place (e.g. through BizPaL, Canada Border Services Agency single window) to collect information from small businesses where possible? | |||
| 2. | Have opportunities to align with other obligations imposed on business by federal, provincial, municipal or international or multinational regulatory bodies been assessed? | |||
| 3. | Has the impact of the proposed Regulations on international or interprovincial trade been assessed? | |||
| 4. | If the data or information, other than personal information, required to comply with the proposed Regulations is already collected by another department or jurisdiction, will this information be obtained from that department or jurisdiction instead of requesting the same information from small businesses or other stakeholders? (The collection, retention, use, disclosure and disposal of personal information are all subject to the requirements of the Privacy Act. Any questions with respect to compliance with the Privacy Act should be referred to the department's or agency's ATIP office or legal services unit.) | |||
| The majority of the information being requested is not currently being required by the provinces or the federal government. | ||||
| 5. | Will forms be pre-populated with information or data already available to the department to reduce the time and cost necessary to complete them? (Example: When a business completes an online application for a licence, upon entering an identifier or a name, the system pre-populates the application with the applicant's personal particulars, such as contact information and date, when that information is already available to the department.) | |||
| The forms will be filled using Environment Canada's electronic reporting system, so basic information should become pre-populated after the first use. | ||||
| 6. | Will electronic reporting and data collection be used, including electronic validation and confirmation of receipt of reports where appropriate? | |||
| 7. | Will reporting, if required by the proposed Regulations, be aligned with generally used business processes or international standards if possible? | |||
| 8. | If additional forms are required, can they be streamlined with existing forms that must be completed for other government information requirements? | |||
| No other existing forms require similar information to be reported. This prevents any streamlining. However, the Environment Canada electronic reporting system will be used. | ||||
| III | Implementation, compliance and service standards | Yes | No | N/A |
| 1. | Has consideration been given to small businesses in remote areas, with special consideration to those that do not have access to high-speed (broadband) Internet? | |||
| 2. | If regulatory authorizations (e.g. licences, permits or certifications) are introduced, will service standards addressing timeliness of decision making be developed that are inclusive of complaints about poor service? | |||
| No such authorizations are being introduced. | ||||
| 3. | Is there a clearly identified contact point or help desk for small businesses and other stakeholders? | |||
| IV | Regulatory flexibility analysis | Yes | No | N/A |
|---|---|---|---|---|
| 1. | Does the RIAS identify at least one flexible option that has lower compliance or administrative costs for small businesses in the small business lens section?
Examples of flexible options to minimize costs are as follows:
|
|||
| In addition to reducing administrative costs for small businesses, Environment Canada is also proposing an exemption from the requirements for original engines for small businesses. Environment Canada reached out to the small business community during consultations in the fall of 2012 and the spring of 2013. Environment Canada has also spoken with industry associations representing both large and small businesses in the oil and gas sectors. The associations were unable to provide the company-level information needed to decide what threshold to set to exempt small businesses from compliance and indicated that small businesses would likely only provide information once draft Regulations were published. Between this publication and final publication in the Canada Gazette, Part Ⅱ, Environment Canada will seek to directly engage small businesses through consultations to introduce workable options to reduce the burden on small businesses. | ||||
| 2. | Does the RIAS include, as part of the Regulatory Flexibility Analysis Statement, quantified and monetized compliance and administrative costs for small businesses associated with the initial option assessed, as well as the flexible, lower-cost option?
|
|||
| 3. | Does the RIAS include, as part of the Regulatory Flexibility Analysis Statement, a consideration of the risks associated with the flexible option? (Minimizing administrative or compliance costs for small business cannot be at the expense of greater health, security or safety or create environmental risks for Canadians.) | |||
| 4. | Does the RIAS include a summary of feedback provided by small business during consultations? | |||
| Environment Canada has attempted to reach out to the small business community on a number of occasions. Between this publication and final publication in the Canada Gazette, Part Ⅱ, Environment Canada will seek to further engage small businesses through targeted consultations. | ||||
| V | Reverse onus | Yes | No | N/A |
| 1. | If the recommended option is not the lower-cost option for small business in terms of administrative or compliance costs, is a reasonable justification provided in the RIAS? | |||
| The recommended option is the lower-cost option. | ||||
PROPOSED REGULATORY TEXT
Notice is given, pursuant to subsection 332(1) (see footnote a) of the Canadian Environmental Protection Act, 1999 (see footnote b), that the Governor in Council, pursuant to subsections 93(1) and 330(3.2) (see footnote c) of that Act, proposes to make the annexed Multi-sector Air Pollutants Regulations.
Any person may, within 60 days after the date of publication of this notice, file with the Minister of the Environment comments with respect to the proposed Regulations or a notice of objection requesting that a board of review be established under section 333 of that Act and stating the reasons for the objection. All comments and notices must cite the Canada Gazette, Part Ⅰ, and the date of publication of this notice, and be sent by mail to Louise Mûˋtivier, Director General, Industrial Sectors Directorate, Department of the Environment, Gatineau, Quebec K1A 0H3, by fax to 819-420-7383 or by email to cleanair-airpur@ec.gc.ca.
A person who provides information to the Minister of the Environment may submit with the information a request for confidentiality under section 313 of that Act.
Ottawa, May 15, 2014
JURICA ČAPKUN
Assistant Clerk of the Privy Council
MULTI-SECTOR AIR POLLUTANTS REGULATIONS
OVERVIEW
Parts 1, 2 and 3
1. (1) For the purpose of protecting the environment and human health, these Regulations establish air pollutant requirements in Parts 1, 2 and 3, respectively, for the emission of
- (a) NOx from boilers and heaters in certain regulated facilities in various industrial sectors;
- (b) NOx from stationary spark-ignition engines that combust gaseous fuels in certain regulated facilities in various industrial sectors; and
- (c) NOx and SO2 from cement manufacturing facilities.
Part 4 — General
(2) Part 4 provides general rules related to
- (a) the CEMS Reference Method governing the use of a continuous emissions monitoring system;
- (b) alternative rules to those in the CEMS Reference Method and in certain other methods incorporated into these Regulations; and
- (c) the reporting, sending, recording and retention of information.
INTERPRETATION
Definitions
2. (1) The following definitions apply in these Regulations.
“Act”
« Loi »
“Act” means the Canadian Environmental Protection Act, 1999.
“alumina facility”
« installation de production d'alumine »
“alumina facility” means a facility that produces alumina from bauxite for use in the production of aluminium.
“aluminium facility”
« aluminerie »
“aluminium facility” means a facility that engages in one or more of the following activities:
- (a) the production of aluminium from alumina;
- (b) the production of pre-baked anodes for use in the production of aluminium; or
- (c) the calcination of petroleum coke for use in the production of aluminium.
“ASTM”
« ASTM »
“ASTM” means ASTM International, formerly known as the American Society for Testing and Materials.
“ASTM D6522-11”
« mûˋthode ASTM D6522-11 »
“ASTM D6522-11” means ASTM D6522-11 method entitled Standard Test Method for Determination of Nitrogen Oxides, Carbon Monoxide, and Oxygen Concentrations in Emissions from Natural Gas-Fired Reciprocating Engines, Combustion Turbines, Boilers, and Process Heaters Using Portable Analyzers published by ASTM.
“authorized official”
« agent autorisûˋ »
“authorized official” means
- (a) in respect of a corporation, an officer of the corporation who is authorized to act on its behalf;
- (b) in respect of any other person, that person or a person authorized to act on behalf of that person; and
- (c) in respect of any other entity, a person authorized to act on its behalf.
“base metals facility”
« installation de production de mûˋtaux communs »
“base metals facility” is a pyrometallurgical or hydrometallurgical facility that recovers or refines one or more of the following metals from feed material that comes primarily from ore:
- (a) nickel;
- (b) copper;
- (c) zinc;
- (d) lead;
- (e) cobalt; and
- (f) chromium.
“boiler”
« chaudière »
“boiler” means combustion equipment that transfers thermal energy from the combustion of a fuel to water or steam or another heat transfer fluid. It does not include combustion equipment that is used only in the generation of electricity for sale.
“cement manufacturing facility”
« cimenterie »
“cement manufacturing facility” means a facility that produces clinker.
“CEMS Reference Method”
« mûˋthode de rûˋfûˋrence SMECE »
“CEMS Reference Method” means the method entitled Protocols and Performance Specifications for Continuous Monitoring of Gaseous Emissions from Thermal Power Generation (EPS 1/PG/7) published, as revised in December 2005 by Her Majesty the Queen in right of Canada, as represented by the Minister.
“CFR”
« CFR »
“CFR” means Title 40, chapter I of the Code of Federal Regulations of the United States.
“chemicals facility”
« installation de fabrication de produits chimiques »
“chemicals facility” means a facility that is primarily engaged in manufacturing chemicals or chemical preparations, from organic or inorganic raw materials and at which one or of more of the following substances are manufactured:
- (a) adipic acid, esters of adipic acid, or amines of adipic acid;
- (b) titanium dioxide;
- (c) carbon black;
- (d) butyl rubber;
- (e) ethylene produced from refined petroleum, liquid hydrocarbons or natural gas;
- (f) ethylene glycol;
- (g) grain ethanol for use in industrial applications or as fuel;
- (h) linear alpha olefins;
- (i) ethylene-based polymers;
- (j) methanol;
- (k) iso-octane;
- (l) hydrogen produced, primarily for sale, from steam reforming;
- (m) linear alkyl benzene;
- (n) purified terephthalic acid;
- (o) paraxylene;
- (p) styrene monomers and polystyrene resins;
- (q) sodium hydroxide;
- (r) citric acid; and
- (s) nylon resins, fibres and filaments.
“clinker”
« clinker »
“clinker” means solid nodules produced by the pyroprocessing of feedstock in a kiln.
“Continuous Emissions Monitoring System” or “CEMS”
« Système de mesure et d'enregistrement en continu des ûˋmissions » ou « SMECE »
“Continuous Emissions Monitoring System” or “CEMS” means equipment for sampling, conditioning and analyzing of emissions from a given source and the recording of data related to those emissions.
“engine”
« moteur »
“engine” means an engine that
- (a) when used, is stationary and is not in or on a machine that
- (i) is self-propelled, or
- (ii) is designed to be propelled while performing its function;
- (b) operates under characteristics significantly similar to the theoretical Otto combustion cycle; and
- (c) uses a spark plug or other sparking device.
“engine registry”
« registre des moteurs »
“engine registry” means the engine registry established under section 60.
“EPA”
« EPA »
“EPA” means the Environmental Protection Agency of the United States.
“EPA Method 3A”
« mûˋthode 3A de l'EPA »
“EPA Method 3A” means the method entitled Method 3A — Determination of Oxygen and Carbon Dioxide Concentrations in Emissions From Stationary Sources (Instrumental Analyzer Procedure), set out in Appendix A-2 of Part 60 of the CFR.
“EPA Method 7E”
« mûˋthode 7E de l'EPA »
“EPA Method 7E” means the method entitled Method 7E — Determination of Nitrogen Oxides Emissions from Stationary Sources (Instrumental Analyzer Procedure), set out in Appendix A-4 of Part 60 of the CFR.
“facility”
« installation »
“facility” means the buildings, other structures or stationary equipment that are located on a single site or adjacent sites and function as a single integrated site.
“gaseous fuel”
« combustible gazeux »
“gaseous fuel” means a fuel that is gaseous at a temperature of 20°C and an absolute pressure of 101.325 kilopascals.
“heater”
« four industriel »
“heater” means combustion equipment that transfers thermal energy from the combustion of a fuel to a material that is being processed outside the combustion chamber.
“iron ore pelletizing facility”
« installation de bouletage du minerai de fer »
“iron ore pelletizing facility” means a facility that produces iron ore pellets from iron ore concentrate using an induration furnace.
“iron, steel and ilmenite facility”
« installation de production de fer, d'acier et d'ilmûˋnite »
“iron, steel and ilmenite facility” means a facility, other than a foundry that produces iron or steel castings, that produces any, or any combination, of:
- (a) metallurgical coke from coal;
- (b) titanium slag or iron from iron-bearing or titanium-bearing ores, including iron ore pellets; and
- (c) steel from iron or scrap steel.
“nitrogen fertilizer facility”
« installation de fabrication d'engrais à base d'azote »
“nitrogen fertilizer facility” means a facility that produces one or more of the following substances:
- (a) anhydrous ammonia, or aqueous ammonia, produced from steam reforming;
- (b) nitric acid; and
- (c) urea.
“NOx”
« NOx »
“NOx” means oxides of nitrogen, which is the sum of nitric oxide (NO) and nitrogen dioxide (NO2).
“oil and gas facility”
« installation d'exploitation pûˋtrolière et gazière »
“oil and gas facility” means a facility that produces, processes or transports hydrocarbons extracted from underground reservoirs, but does not include a facility engaged in the local distribution of natural gas, an oil sands facility, a petroleum refinery, a chemicals facility or a nitrogen fertilizer facility.
“oil sands facility”
« installation d'exploitation de sables bitumineux »
“oil sands facility” means a facility, other than a facility that principally engaged in the production of asphalt, engaged in one or more of the following activities:
- (a) surface mining of bitumen-containing or crude oil-containing sand;
- (b) the extraction of bitumen or crude oil from underground using thermal methods;
- (c) the processing of bitumen-containing or crude oil-containing sand to extract bitumen or crude oil; or
- (d) the upgrading by means of the conversion of bitumen or crude oil, or of blends of crude oil and other hydrocarbon compounds, to produce petroleum products other than gasoline.
“operator”
« exploitant »
“operator” means a person that has the charge, management or control of a boiler or heater, an engine or a cement manufacturing facility.
“petroleum refinery”
« raffinerie de pûˋtrole »
“petroleum refinery” means a facility that processes crude oil into gasoline and other petroleum products or a lubricants facility that processes crude oil-based feedstock into lubricating oil-based stock.
“potash facility”
« installation de production de potasse »
“potash facility” means a facility that produces potash, including those facilities that extract potash-bearing ore.
“power plant”
« centrale ûˋlectrique »
“power plant” means a facility whose primary purpose is the production of electricity for sale to the electric grid.
“pulp and paper facility”
« installation de production de pâte et papier »
“pulp and paper facility” means a facility that is designed or used to produce
- (a) pulp products from wood, other plant material or paper products; or
- (b) any product from pulp or a pulping process.
“responsible person”
« personne responsable »
“responsible person” means an owner or operator of a boiler or heater, an engine or a cement manufacturing facility.
“SO2”
« SO2 »
“SO2” means sulphur dioxide, which has the molecular formula SO2.
“steady-state”
« ûˋtat stable »
“steady-state” means an operating state that is other than start-up, shutdown and upset.
“year”
« annûˋe »
“year” means a calendar year.
Interpretation of incorporated documents
(2) For the purpose of interpreting any document incorporated by reference into these Regulations, “should” must be read to mean “must” and any recommendation or suggestion must be read as an obligation.
EPA discretion
(3) Any EPA method incorporated by reference into these Regulations must be read as excluding references to the EPA or the Administrator of the EPA exercising discretion in any way.
Inconsistency
(4) In the event of an inconsistency between a provision of these Regulations and any document incorporated by reference in these Regulations, that provision prevails to the extent of the inconsistency.
Methods incorporated by reference
(5) Any method of the EPA or ASTM that is incorporated by reference into these Regulations is incorporated as amended from time to time.
PART 1
BOILERS AND HEATERS
INTERPRETATION
Definitions
3. The following definitions apply in this Part and in Schedules 1 to 4.
“alternative gas”
« gaz de remplacement »
“alternative gas” means a gaseous fossil fuel other than natural gas.
“anode baking furnace”
« four de cuisson d'anodes »
“anode baking furnace” means a heater that bakes green anodes to produce blocks of carbon for use in the production of aluminium.
“ASTM D1945-03”
« mûˋthode ASTM D1945-03 »
“ASTM D1945-03” means ASTM D1945-03 method entitled Standard Test Method for Analysis of Natural Gas by Gas Chromatography, published by ASTM.
“ASTM D1946-90”
« mûˋthode ASTM D1946-90 »
“ASTM D1946-90” means ASTM D1946-90 method entitled Standard Practice for Analysis of Reformed Gas by Gas Chromatography, published by ASTM.
“blast furnace stove”
« rûˋcupûˋrateur de haut fourneau »
“blast furnace stove” means a vertical cylindrical regenerator filled with refractory used to preheat ambient air that is then introduced into a blast furnace used in ironmaking.
“chemical recovery boiler”
« chaudière de rûˋcupûˋration chimique »
“chemical recovery boiler” means a boiler whose fuel includes spent pulping liquor and that recovers chemical components from the combustion of that spent pulping liquor.
“coke oven”
« four à coke »
“coke oven” means a heater that converts coal to coke through distillation.
“coke oven battery”
« batterie de fours à coke »
“coke oven battery” means alternating multiple banks of coke ovens.
“commercial grade natural gas”
« gaz naturel de qualitûˋ commerciale »
“commercial grade natural gas” means natural gas purchased from a commercial supplier.
“commissioning date”
« date de mise en service »
“commissioning date” means the day on which a boiler or heater begins to produce thermal energy primarily for use in production or to provide heat.
“emission-intensity”
« intensitûˋ d'ûˋmission »
“emission-intensity” means the rate at which a boiler or heater emits NOx in relation to the thermal energy of the fuel it combusts, expressed in grams of NOx emitted per Gigajoule of thermal energy in the fuel (g/GJ).
“ethylene cracker”
« craqueur d'ûˋthylène »
“ethylene cracker” means a heater that transforms a mixture of steam and hydrocarbon into hydrocarbon gases, notably ethylene.
“gaseous fossil fuel”
« combustible fossile gazeux »
“gaseous fossil fuel” includes gaseous fossil fuel that is a by-product of an industrial process or operation that has constituents with thermal energy value.
“modern”
« moderne »
“modern”, in relation to a boiler or heater, means a boiler or heater that is neither original nor transitional.
“natural gas”
« gaz naturel »
“natural gas” means a gaseous fossil fuel that consists of least 90% methane by volume.
“original”
« d'origine »
“original”, in relation to a boiler or heater, means a boiler or heater whose commissioning date is before January 1, 2015.
“ppmvd”
« ppmvs »
“ppmvd” means parts per million, on a volumetric dry basis.
“preheated air”
« air prûˋchauffûˋ »
“preheated air” means air that is preheated above ambient air temperature before it is introduced into the combustion chamber of a heater.
“rated capacity”
« capacitûˋ nominale »
“rated capacity”, in relation to a boiler or heater, means the maximum thermal energy contained in fuel that the boiler or heater is designed to be able to combust per hour, expressed in GJ/hr, as specified on the nameplate affixed to the boiler or heater by its manufacturer.
“reheat furnace”
« four de rûˋchauffage »
“reheat furnace” means a heater in which steel is re-heated for hot rolling into basic shapes.
“standard m3”
« m3 normalisûˋ »
“standard m3” has the meaning assigned to a cubic metre at standard pressure and standard temperature by the definition “standard volume” in subsection 2(1) of the Electricity and Gas Inspection Regulations.
“steam methane reformer”
« reformeur de mûˋthane à vapeur »
“steam methane reformer” means a heater that transforms a mixture of steam and hydrocarbons in the presence of a catalyst to produce hydrogen and carbon oxides.
“transitional”
« de transition »
“transitional”, in relation to a boiler or heater, means a boiler or heater whose
- (a) assembly occurs at the facility where it is located; and
- (b) commissioning date is in the period that begins on January 1, 2015 and that ends on December 31, 2016.
APPLICATION
10.5 GJ/hr
4. (1) This Part applies in respect of a boiler or a heater in a regulated facility that is designed to combust gaseous fossil fuel and has a rated capacity greater than or equal to 10.5 GJ/hr.
Regulated facilities
(2) The following are the regulated facilities:
- (a) oil and gas facilities;
- (b) oil sands facilities;
- (c) chemicals facilities and nitrogen fertilizer facilities;
- (d) pulp and paper facilities;
- (e) base metals facilities;
- (f) potash facilities;
- (g) alumina facilities and aluminium facilities;
- (h) power plants;
- (i) iron, steel and ilmenite facilities;
- (j) iron ore pelletizing facilities; and
- (k) cement manufacturing facilities.
Excluded boilers and heaters
(3) Despite subsections (1) and (2), this Part does not apply in respect of the following types of boiler or heater:
- (a) a heater that is used to dry, bake or calcinate materials, including a kiln within the meaning of section 65 and an anode baking furnace;
- (b) a heater that is used in any process to chemically transform ore or intermediate products into bulk metallic products;
- (c) a heater that combusts coke oven gas;
- (d) an ethylene cracker;
- (e) a steam methane reformer;
- (f) a coke oven, including coke ovens in a coke oven battery;
- (g) a blast furnace stove;
- (h) a reheat furnace;
- (i) a boiler or heater that is used exclusively for activities that are subsequent to the hot rolling of steel into basic shapes in an iron, steel and ilmenite facility; and
- (j) a chemical recovery boiler.
OBLIGATIONS
Modern boilers
5. (1) The responsible person for a modern boiler that has at least 50% of the input energy in its combustion chamber coming from gaseous fossil fuel, set out in column 1 of the table to this subsection, and a thermal efficiency set out in column 2, must ensure that the emission-intensity of the boiler is less than or equal to the emission-intensity limit set out in column 3.
| Item | Column 1 Gaseous Fossil Fuel |
Column 2 Thermal Efficiency |
Column 3 Emission-intensity Limit (g/GJ) |
|---|---|---|---|
| 1. | natural gas | < 80% | 16 |
| 2. | natural gas | ≥ 80% and ≤ 90% | 16 + (E − 80)⁄5, where E is the thermal efficiency of the boiler |
| 3. | natural gas | > 90% | 18 |
| 4. | alternative gas | < 80% | 20.8 |
| 5. | alternative gas | ≥ 80% and ≤ 90% | 20.8 + (E − 80)⁄4.54, where E is the efficiency of the boiler |
| 6. | alternative gas | > 90% | 23 |
Modern heaters
(2) The responsible person for a modern heater that has at least 50% of the input energy in its combustion chamber coming from gaseous fossil fuel, set out in column 1 of the table to this subsection, and uses preheated air at the number of degrees, expressed in °C, above ambient air temperature, if any, set out in column 2 must ensure that the emission-intensity of the heater is less than or equal to the emission-intensity limit set out in column 3.
| Item | Column 1 Gaseous Fossil Fuel |
Column 2 Number of Degrees Above Ambient Air Temperature of Reheated Air |
Column 3 Emission-intensity Limit (g/GJ) |
|---|---|---|---|
| 1. | natural gas | 0°C | 16 |
| 2. | natural gas | > 0°C and ≤ 150°C | 16 × [1 + (2 x 10⁻⁴T) + (7 x 10⁻⁶T2)], where T is the number of degrees, expressed in °C, above ambient air temperature of the preheated air |
| 3. | natural gas | > 150°C | 19 |
| 4. | alternative gas | 0°C | 20.8 |
| 5. | alternative gas | > 0°C and ≤ 155°C | 20.8 × [1 + (2 x 10⁻⁴T) + (7 x 10⁻⁶T2)], where T is the number of degrees, expressed in °C, above ambient air temperature of the preheated air |
| 6. | alternative gas | > 155°C | 25 |
Transitional boilers or heaters
6. The responsible person for the following types of a transitional boiler or heater that has at least 50% of the input energy in its combustion chamber coming from gaseous fossil fuel must ensure that the emission-intensity of the boiler or heater is less than or equal to
- (a) 26 g/GJ, for a boiler and heater that has a rated capacity of greater than or equal to 10.5 GJ/hr and less than or equal to 105 GJ/hr; and
- (b) 40 g/GJ, for a boiler and heater that has a rated capacity of greater than 105 GJ/hr.
Original boilers and heaters
7. (1) The responsible person for a class 80 original boiler or heater or a class 70 original boiler or heater that has at least 50% of the input energy in its combustion chamber coming from gaseous fossil fuel must ensure that the emission-intensity of the boiler or heater is less than or equal to 26 g/GJ, as of
- (a) January 1, 2026, for a class 80 boiler or heater; and
- (b) January 1, 2036, for a class 70 boiler or heater.
Class 70 boilers and heaters
(2) A class 70 original boiler or heater is an original boiler or heater for which an initial test conducted under section 21 or a change test conducted under section 26 resulted in its emission-intensity being equal to or greater than 70 g/GJ and less than 80 g/GJ.
Class 80 boilers and heaters
(3) A class 80 original boiler or heater is an original boiler or heater for which an initial test conducted under section 21 or a change test conducted under section 26 resulted in its emission-intensity being equal to or greater than 80 g/GJ.
Both initial test and change test
(4) If both an initial test and a change test are conducted, the greater of the resulting emission-intensities is to be used for the purpose of subsection (2) or (3).
Major modifications — original boilers and heaters
8. (1) The responsible person for a boiler or heater referred to in subsection 7(1) that has undergone a major modification before the date referred to in paragraph 7(1)(a) or (b), as the case may be, must, as of the commissioning date for the boiler or heater with that major modification, ensure that the emission-intensity of the boiler or heater is less than or equal to 26 g/GJ.
Major modifications
(2) The major modifications are
- (a) for a boiler or heater with a single burner or double burner, the replacement of a burner;
- (b) the replacement, within a period of at most 60 months, of at least three burners in a boiler or heater that has at least three burners; and
- (c) the relocation of a boiler or heater.
Exception — impossibility
9. (1) Despite subsection 8(1), if it is established in accordance with subsection (2) that a boiler or heater would not, under any circumstances when operated under normal conditions after it has undergone a major modification, have an emission-intensity of less than or equal to 26 g/GJ, the responsible person for the boiler or heater with that major modification must ensure that its emission-intensity is less than 50% of its emission-intensity as reported in the initial report referred to in section 29.
Establishment
(2) In order to establish that a boiler or heater that undergoes a major modification would not have an emission-intensity of less than or equal to 26 g/GJ, the responsible person for the boiler or heater must send the following to the Minister:
- (a) documents, provided to the responsible person by a person who is independent of the responsible person, that establish, based on the plans for carrying out the major modification, that the boiler or heater — when operated under normal conditions after the major modification is completed — could not, under any circumstances, have an emission-intensity less than or equal to 26 g/GJ;
- (b) a signed certificate, provided to the responsible person by another person who is independent of both the responsible person and the independent person referred to in paragraph (a), indicating that they have, before the major modification is carried out, reviewed the documents referred to in paragraph (a) and agree that the documents establish that the boiler or heater — when operated under normal conditions after the major modification is completed — could not, under any circumstances, have an emission-intensity less than or equal to 26 g/GJ; and
- (c) documents establishing that each of the independent persons referred to in paragraphs (a) and (b) has demonstrated knowledge of and at least five years' experience in the design of low-NOx burner technology.
QUANTIFICATION
Input Energy
Input energy
10. For the purposes of sections 5 to 9, the responsible person for a boiler or heater must, when the boiler or heater is operating at a steady-state, determine the percentage of the input energy in its combustion chamber coming from gaseous fossil fuel by using the formula
(Eng + Ealt)⁄(Eng + Ealt + Eo) × 100
where
Eng is the energy input from natural gas, determined by the formula
0.03793Qng
where
Qng is the quantity of natural gas combusted, as measured by a flow meter on the input, expressed in standard m3;
Ealt is the energy input from alternative gas, determined by the formula
QaltHHValt
where
Qalt is the quantity of the alternative gas combusted, as measured by a flow meter on the input, expressed in standard m3, and
HHValt is the higher heating value of the alternative gas combusted, expressed in GJ/standard m3, determined in accordance with paragraphs 12(3)(a) and (b); and
Eo is the energy input, expressed in GJ, from a fuel other than gaseous fossil fuel, determined by using the formula
ΣQoiHHVoi
where
Qoi is the quantity of the ith fuel combusted, other than gaseous fossil fuel, as measured by a flowmeter on the input
HHVoi is the higher heating value of the ith fuel combusted, other than gaseous fossil fuel, as determined in accordance with paragraphs 12(3)(a) and (b), and
i is the ith fuel combusted, other than gaseous fossil fuel, where i goes from 1 to n and where n is the number of those fuels combusted.
Type of Gas
Methane content — weighted average
11. (1) For the purpose of the definition “natural gas” in section 3 and of section 5, the methane content of the gaseous fossil fuel introduced into the combustion chamber of a boiler or heater is to be calculated as a weighted average by using the formula
[(%CH4 ng × Qng) + (%CH4 alt × Qalt)]⁄(Qng + Qalt)
where
%CH4 ng is the percentage of the methane content, determined under subsection (2), of the quantity of natural gas introduced into the combustion chamber;
Qng is the quantity of the natural gas introduced into the combustion chamber as measured by a flow meter on the input, expressed in standard m3;
%CH4 alt is the percentage of the methane content, determined under subsection (2), of the quantity of alternative gas introduced into the combustion chamber; and
Qalt is the quantity of the alternative gas introduced into the combustion chamber as measured by a flow meter on the input, expressed in standard m3.
Gas introduced to combustion chamber
(2) The percentage of the methane content of a gaseous fossil fuel introduced into the combustion chamber is
- (a) for commercial grade natural gas, 95%; and
- (b) for any other gas, determined by the method, as applicable
- (i) ASTM D1945-03, or
- (ii) ASTM D1946-90.
Thermal Efficiency
Thermal efficiency
12. (1) For the purpose of subsection 5(1), the responsible person must determine the thermal efficiency of a modern boiler by using the formula
100% − Ldfg − LH − Lrc − Lua
where
Ldfg is the percentage of loss of thermal efficiency due to the energy content of dry flue gas determined in accordance with subsection (2);
LH is the percentage of loss of thermal efficiency due to the energy content of the water in the flue gas, where LH is determined by using the formula
8.94H × [2450 + 1.989(Tg − Ta)]⁄HHVm × 100
where
H is the concentration of hydrogen in the fuel combusted, expressed in kg of hydrogen per kg of that fuel, being
- (a) for commercial grade natural gas, 0.237 kg/kg, and
- (b) in any other case, determined in accordance with subsection (5),
Tg is the temperature, expressed in °C, of the flue gas, as measured in the stack,
Ta is the ambient air temperature, expressed in °C, when the fuel was combusted, and
HHVm is the higher heating value of the fuel combusted, expressed on a mass basis in kJ/kg, being
- (a) for commercial grade natural gas, 51 800 kJ/kg, and
- (b) in any other case, determined in accordance with subsection (3);
Lrc is the percentage of loss of thermal efficiency from radiation and from convection of the boiler's surfaces, being
- (a) for a watertube boiler, the percentage set out in Schedule 1 for the rated capacity of the boiler and the percentage of rated capacity at which the boiler is operating,
- (b) for a firetube boiler, 0.5%, and
- (c) in any other case, 1%;
Lua is the percentage of loss of thermal efficiency whose sources are unaccounted for, which is deemed to be 0.1%.
Loss due to dry flue gas
(2) The percentage of loss of thermal efficiency due to the energy content of dry flue gas, Ldfg, is determined by using the formula
1.005(Tg − Ta)⁄HHVm × Mg × 100
where
Tg is the temperature, expressed in °C, of the flue gas, as measured in the stack;
Ta is the ambient air temperature, expressed in °C, when the fuel was combusted;
HHVm is the higher heating value of the fuel combusted, expressed on a mass basis in kJ/kg, being
- (a) for commercial grade natural gas, 51 800 kJ/kg, and
- (b) in any other case, the higher heating value of the fuel determined in accordance with subsection (3); and
Mg is the ratio of the mass of the flue gas to the mass of the fuel combusted, expressed in kg/kg, where Mg is determined by using the formula
0.962 × [1 + %O2⁄(20.9 − %O2)] × Ms
where
%O2 is the number that represents the percentage of oxygen, on a dry volumetric basis, in the flue gas, determined in accordance with subsection (5),
Ms is the ratio of the stoichiometric mass of the flue gas to the mass of the fuel combusted, expressed in kg/kg, where Ms is
- (a) for commercial grade natural gas, 15.3 kg/kg, and
- (b) in any other case, determined by using the following formula where the concentration of each of the chemical elements is determined in accordance with subsection (5):
12.492C + 26.296H + N + 5.305S − 3.313O
where
C is the concentration of carbon in the fuel combusted, expressed in kg of carbon per kg of that fuel,
H is the concentration of hydrogen in the fuel combusted, expressed in kg of hydrogen per kg of that fuel,
N is the concentration of nitrogen in the fuel combusted, expressed in kg of nitrogen per kg of that fuel,
S is the concentration of sulphur in the fuel combusted, expressed in kg of sulphur per kg of that fuel, and
O is the concentration of oxygen in the fuel combusted, expressed in kg of oxygen per kg of that fuel.
Determination of HHV
(3) The higher heating value, HHV, is to be determined
- (a) if a single gaseous fossil fuel is introduced into the combustion chamber,
- (i) in accordance with one of the required HHV methods referred to in subsection (4), as applicable, or
- (ii) by using the default higher heating value set out in column 2 of the applicable table to Schedule 2 for the type of fuel set out in column 1 of that table; and
- (b) in any other case, as a weighted average, for which the higher heating value of each fuel introduced into the combustion chamber is
- (i) determined in accordance with one of the required HHV methods referred to in subsection (4), as applicable, or
- (ii) by using the default higher heating value set out in column 2 of the applicable table to Schedule 2 for the type of fuel set out in column 1 of that table.
Required HHV methods
(4) The required HHV methods are
- (a) for gaseous fuels, as applicable,
- (i) ASTM D1826-94, entitled Standard Test Method for Calorific (Heating) Value of Gases in Natural Gas Range by Continuous Recording Calorimeter, published by ASTM,
- (ii) ASTM D3588-98, entitled Standard Practice for Calculating Heat Value, Compressibility Factor, and Relative Density of Gaseous Fuels, published by ASTM,
- (iii) ASTM D4891-89, entitled Standard Test Method for Heating Value of Gases in Natural Gas Range by Stoichiometric Combustion, published by ASTM, and
- (iv) GPA Standard 2172-09, entitled Calculation of Gross Heating Value, Relative Density, Compressibility and Theoretical Hydrocarbon Liquid Content for Natural Gas Mixtures for Custody Transfer, published by the Gas Processors Association;
- (b) for liquid fuels, as applicable,
- (i) ASTM D240-09, entitled Standard Test Method for Heat of Combustion of Liquid Hydrocarbon Fuels by Bomb Calorimeter, published by ASTM, and
- (ii) ASTM D4809-09ae1, entitled Standard Test Method for Heat of Combustion of Liquid Hydrocarbon Fuels by Bomb Calorimeter (Precision Method), published by ASTM; and
- (c) for solid fuels, as applicable,
- (i) ASTM D5865-12, entitled Standard Test Method for Gross Calorific Value of Coal and Coke, published by ASTM, and
- (ii) ASTM D5468-02, entitled Standard Test Method for Gross Calorific and Ash Value of Waste Materials, published by ASTM.
Constituents of fuel
(5) The responsible person must ensure that the concentration of carbon, hydrogen, nitrogen, sulphur and oxygen per kilogram of fuel — other than commercial grade natural gas — combusted is to be determined
- (a) if a single gaseous fossil fuel is introduced into the combustion chamber, in accordance with the required methods for determining the concentration of the constituents of fuel referred to in subsection (6), as applicable; and
- (b) in any other case, as a weighted average, for which the concentration of each of those chemical elements for each fuel introduced into the combustion chamber is measured in accordance with the required methods for determining the concentration of the constituents of fuel referred to in subsection (6), as applicable.
Required concentration standards and calculation method
(6) The required methods for determining the concentration of the constituents of fuel are
- (a) for gaseous fuels, as applicable
- (i) ASTM D1945-03, and
- (ii) ASTM D1946-90;
- (b) for liquid fuels, as applicable,
- (i) ASTM D5291-10, entitled Standard Test Methods for Instrumental Determination of Carbon, Hydrogen, and Nitrogen in Petroleum Products and Lubricants, published by ASTM, for the concentration of carbon, hydrogen and nitrogen,
- (ii) ASTM D4294-10, entitled Standard Test Method for Sulfur in Petroleum and Petroleum Products by Energy Dispersive X-ray Fluorescence Spectrometry, published by ASTM, for the concentration of sulphur, and
- (iii) the remaining concentration after removing the determinations made for the concentrations of carbon, hydrogen, nitrogen and sulphur, for the concentration of oxygen; and
- (c) for solid fuel
- (i) that is coal or coke, as applicable,
- (A) ASTM D5373-08, entitled Standard Test Methods for Instrumental Determination of Carbon, Hydrogen, and Nitrogen in Laboratory Samples of Coal, published by ASTM, for the concentration of carbon, hydrogen and nitrogen,
- (B) ASTM D4239-12 entitled Standard Test Method for Sulfur in the Analysis Sample of Coal and Coke Using High-Temperature Tube Furnace Combustion, published by ASTM, for the concentration of sulphur, and
- (C) the remaining concentration after removing the determinations made for the concentrations of carbon, hydrogen, nitrogen and sulphur, for the concentration of oxygen, and
- (ii) that is derived from waste, as applicable,
- (A) ASTM E777-08, entitled Standard Test Method for Carbon and Hydrogen in the Analysis Sample of Refuse-Derived Fuel, published by ASTM, for the concentration of carbon and hydrogen,
- (B) ASTM E778-08, entitled Standard Test Methods for Nitrogen in the Analysis Sample of Refuse-Derived Fuel, published by ASTM, for the concentration of nitrogen
- (C) ASTM E775-87e1, entitled Standard Test Methods for Total Sulfur in the Analysis Sample of Refuse-Derived Fuel, published by ASTM, for the concentration of sulphur, and
- (D) the remaining concentration after removing the determinations made for the concentrations of carbon, hydrogen, nitrogen and sulphur, for the concentration of oxygen.
- (i) that is coal or coke, as applicable,
Emission-intensity
Determination
Up to 262.5 GJ/hr
13. (1) For the purpose of sections 5 to 9, the emission-intensity of a boiler or heater that has a rated capacity of less than or equal to 262.5 GJ/hr is to be determined
- (a) using a stack test in accordance with sections 14 to 17; or
- (b) using a CEMS.
More than 262.5 GJ/hr — modern or transitional
(2) For the purpose of sections 5 and 6, the emission-intensity of a modern or transitional boiler or heater that has a rated capacity of greater than 262.5 GJ/hr is to be determined using a CEMS.
More than 262.5 GJ/hr — classes 80 and 70
(3) For the purpose of sections 7 to 9, the emission-intensity of a class 80 original boiler or heater or a class 70 original boiler or heater that has a rated capacity of greater than 262.5 GJ/hr is to be determined using a CEMS as of
- (a) for a class 80 original boiler or heater, the earlier of the commissioning date, if any, for the boiler or heater with a major modification and January 1, 2026; or
- (b) for a class 70 original boiler or heater, the earlier of the commissioning date, if any, for the boiler or heater with a major modification and January 1, 2036.
Stack Tests
Three test-runs
14. (1) A stack test consists of three consecutive test-runs, conducted within 48 hours, of at least 30 minutes each.
Conditions for test-runs
(2) Each test-run must be conducted when the boiler or heater is operating
- (a) at 60% or more of its rated capacity;
- (b) at a steady-state; and
- (c) with preheated air at the rated capacity of the equipment used to preheat the air, for heaters that are equipped to preheat air.
Simultaneous measurement of NOx and O2
15. (1) During each test-run, the concentration of NOx, expressed in ppmvd, and of O2, expressed as a percentage, must be measured simultaneously.
Standards for measurement
(2) Those concentrations are to be measured in accordance with the following methods:
- (a) EPA Method 7E, for the concentration of NOx, and EPA Method 3A, for the concentration of O2; or
- (b) ASTM D6522-11.
Determination of emission-intensity
16. Based on the measured concentrations of NOx and O2, the emission-intensity, expressed in g/GJ, of the boiler or heater for each test-run is to be determined
- (a) using the applicable F-factor equations in sections A.2, A.3, A.6 and A.7 of Appendix A to the CEMS Reference Method; or
- (b) by using the formula
(NOx û 1.88 û 10-3 û Fs)/öÈ(Fi û HHVi) û 20.9/(20.9 ãô %O2)
- where
- NOxô is the concentration of NOx as measured in accordance with section 15,
- Fsô is the flow rate of the flue gas as measured in the test-run, expressed in m3/hr, at 25ô¯C and 101.325 kPa,
- Fiô is the flow rate of the ith fuel combusted, expressed in a given unit/hr, as measured simultaneously with the measurement of the concentrations of NOx and O2 in accordance with section 15,
- HHViô is the higher heating value of the ith fuel combusted, expressed in GJ/the given unit referred to in the description of Fi, being
- (a) for commercial grade natural gas, 0.03793 GJ/standard m3, and
- (b) in any other case, the higher heating value of that ith fuel as measured in accordance with subsection 12(3),
- iô is the ith fuel combusted and i goes from 1 to n, where n is the number of fuels combusted, and
- %O2ô is the number that represents the percentage of oxygen, on a dry volumetric basis, in the flue gas, determined in accordance with subsection 12(5).
Emission-intensity average
17. The emission-intensity of the boiler or heater is the average of the results for each of those three test-runs.
Continuous Emissions Monitoring System
Rolling hourly average ã 720 hours and more
18. (1) In the case of a boiler or heater whose emission-intensity is determined by a CEMS and that combusts only, as the case may be, natural gas or alternative gas, for a period of 720 hours, its emission-intensity, during the 720th hour of that period, is the rolling hourly average for that 720th hour, namely the average of the hourly emission-intensities of the boiler or heater for each of those 720 hours.
Rolling hourly average ã less than 720 hours
(2) In the case of a boiler or heater whose emission-intensity is determined by a CEMS and that combusts only, as the case may be, natural gas or alternative gas, for a period of hours, ãhã, where ãhã is less than 720 hours, its emission-intensity, during each hour of that period, is the rolling hourly average for that hth hour.
Hourly emission-intensity
(3) The hourly emission-intensity, for an hour, is the average, over the hour, as determined in accordance with section 3.4.1 of the CEMS Reference Method, of the emission-intensities of the boiler or heater.
TESTING
Initial Tests
Initial test ã modern or transitional and ãÊ 262.5 GJ/hr
19. (1) A responsible person for a modern or transitional boiler, or heater, that has a rated capacity of greater than or equal to 10.5 GJ/hr and less than or equal to 262.5 GJ/hr must determine the emission-intensity of the boiler or heater ã under conditions in which at least 50% of the input energy in its combustion chamber comes from gaseous fossil fuel ã by means of one of the following initial tests:
- (a) an initial stack test conducted in accordance with sections 14 to 17; or
- (b) the use of a CEMS ã for those hours during which at least 50% of the input energy in its combustion chamber comes from gaseous fossil fuel ã during the reference period, with the result of the initial CEMS test being
- (i) if there are at least 720 of those hours in the reference period, the greatest rolling hourly average among the rolling hourly averages, determined in accordance with subsection 18(1), for each period consisting of 720 of those hours in the reference period, and
- (ii) if there are less than 720 of those hours in the reference period, the rolling hourly average, determined in accordance with subsection 18(2), for the final hour of those hours.
Completion of initial test
(2) The initial test must be completed by December 31 of the year that includes the commissioning date of the boiler or heater.
Reference period
(3) The reference period is the period that begins on the day following the commissioning date of the boiler or heater and ends on December 31 of the year that includes the day on which the reference period begins.
Initial test ã modern or transitional and > 262.5 GJ/hr
20. (1) A responsible person for a modern or transitional boiler, or heater, that has a rated capacity of greater than 262.5 GJ/hr must determine the emission-intensity of the boiler or heater by means of the use of a CEMS ã for those hours during which at least 50% of the input energy in its combustion chamber comes from gaseous fossil fuel ã during the reference period, with the result of the initial CEMS test being
- (a) if there are at least 720 of those hours in the reference period, the greatest rolling hourly average among the rolling hourly averages, determined in accordance with subsection 18(1), for each period consisting of 720 of those hours in the reference period; and
- (b) if there are less than 720 of those hours in the reference period, the rolling hourly average, determined in accordance with subsection 18(2), for the final hour of those hours.
Completion of initial test
(2) The initial test must be completed by December 31 of the year that includes the commissioning date of the boiler or heater.
Reference period
(3) The reference period is the period that begins on the day following the commissioning date of the boiler or heater and ends on December 31 of the year that includes the day on which the reference period begins.
Initial test ã Original
21. (1) Subject to subsection (6), a responsible person for an original boiler or heater must determine the emission-intensity of the boiler or heater ã under conditions in which at least 50% of the input energy in its combustion chamber comes from gaseous fossil fuel ã by means of one of the following initial tests:
- (a) an initial stack test conducted in accordance with sections 14 to 17; or
- (b) the use of a CEMS ã for those hours during which at least 50% of the input energy in its combustion chamber comes from gaseous fossil fuel ã during the reference period, with the result of the initial CEMS test being
- (i) if there are at least 720 of those hours in the reference period, the greatest rolling hourly average among the rolling hourly averages, determined in accordance with subsection 18(1), for each period consisting of 720 of those hours in the reference period, and
- (ii) if there are less than 720 of those hours in the reference period, the rolling hourly average, determined in accordance with subsection 18(2), for the final hour of those hours.
Completion of initial test
(2) The initial test must be completed
- (a) if the boiler or heater has combusted gaseous fossil fuel before January 1, 2015, before January 1, 2016;
- (b) if the boiler or heater, other than one referred to in paragraph (a), begins to combust gaseous fossil fuel before January 1, 2026, by the earlier of
- (i) the day that is 12 months after the day on which gaseous fossil fuel was first combusted, and
- (ii) December 31, 2025; and
- (c) if the boiler or heater begins to combust gaseous fossil fuel on or after January 1, 2026, within 31 days after the day on which gaseous fossil fuel was first combusted.
Reference period
(3) The reference period
- (a) if the boiler or heater has combusted gaseous fossil fuel before January 1, 2015, begins on January 1, 2015 and ends on December 31, 2015;
- (b) if the boiler or heater, other than one referred to in paragraph (a), begins to combust gaseous fossil fuel before January 1, 2026, begins on the day following the day on which the boiler or heater begins to combust gaseous fossil fuel and ends on the earlier of
- (i) the day that is 12 months after the day on which gaseous fossil fuel was first combusted, and
- (ii) December 31, 2025; and
- (c) if the boiler or heater begins to combust gaseous fossil fuel on or after January 1, 2026, begins on the day following the day on which gaseous fossil fuel was first combusted and ends 31 days after that day.
Precision ã major modifications
(4) An initial test conducted in accordance with subsection (1) must be conducted before carrying out a major modification referred to in subsection 8(2).
Tests made 2011 to 2014, inclusive
(5) A stack test ã conducted in accordance with sections 14 to 17 under conditions in which at least 50% of the input energy in its combustion chamber comes from gaseous fossil fuel ã that is conducted in the period that begins on January 1, 2011 and ends on December 31, 2014 may, at the option of the responsible person, be considered to be the initial stack test referred to in paragraph (1)(a).
Default emission-intensity
(6) If an initial test is not conducted under subsection (1), the result of an initial test to determine the emission-intensity of the boiler or heater is deemed to be 80 g/GJ.
Annual Tests
Modern or transitional ã 105 GJ/hr to 262.5 GJ/hr
22. Beginning in the year following the year in which an initial test was conducted, a responsible person for a modern or transitional boiler, or heater, that has a rated capacity of greater than 105 GJ/hr and less than or equal to 262.5 GJ/hr must determine the emission-intensity of the boiler or heater by means of one of the following annual tests:
- (a) an annual stack test conducted in accordance with sections 14 to 17 ã under conditions in which at least 50% of the input energy in its combustion chamber comes from gaseous fossil fuel ã and conducted at least 90 days after any previous stack test; or
- (b) the use of a CEMS ã for those hours during which at least 50% of the input energy in its combustion chamber comes from gaseous fossil fuel ã during the year in question, with the result of the annual CEMS test being
- (i) if there are at least 720 of those hours in the year in question, the greatest rolling hourly average among the rolling hourly averages, determined in accordance with subsection 18(1), for each period consisting of 720 of those hours in the year in question, and
- (ii) if there are less than 720 of those hours in the year in question, the rolling hourly average, determined in accordance with subsection 18(2), for the final hour of those hours.
Modern or transitional ã greater 262.5 GJ/hr
23. Beginning in the year following the year in which an initial test was conducted, a responsible person for a modern or transitional boiler, or heater, that has a rated capacity of greater than 262.5 GJ/hr must determine the emission-intensity of the boiler or heater by means of the use of a CEMS ã for those hours during which at least 50% of the input energy in its combustion chamber comes from gaseous fossil fuel ã during the year in question, with the result of the annual CEMS test being
- (a) if there are at least 720 of those hours in the year in question, the greatest rolling hourly average among the rolling hourly averages, determined in accordance with subsection 18(1), for each period consisting of 720 of those hours in the year in question; and
- (b) if there are less than 720 of those hours in the year in question, the rolling hourly average, determined in accordance with subsection 18(2), for the final hour of those hours.
Major modification ã first annual tests
24. (1) A responsible person for a class 80 original boiler or heater or a class 70 original boiler or heater that has undergone a major modification referred to in subsection 8(2) must determine the emission-intensity of the boiler or heater ã under conditions in which at least 50% of the input energy in its combustion chamber comes from gaseous fossil fuel ã by means of one of the following first annual tests:
- (a) a first annual stack test conducted in accordance with sections 14 to 17; or
- (b) the use of a CEMS ã for those hours during which at least 50% of the input energy in its combustion chamber comes from gaseous fossil fuel ã during the reference period, with the result of the annual CEMS test being
- (i) if there are at least 720 of those hours in the reference period, the greatest rolling hourly average among the rolling hourly averages, determined in accordance with subsection 18(1), for each period consisting of 720 of those hours in the reference period, and
- (ii) if there are less than 720 of those hours in the reference period, the rolling hourly average, determined in accordance with subsection 18(2), for the final hour of those hours.
Completion of initial test
(2) The first annual test must be completed by December 31 of the year that includes the commissioning date of the boiler or heater with the major modification.
Reference period
(3) The reference period is the period that begins on the day following the commissioning date of the boiler or heater with the major modification and ends on December 31 of the year that includes that the day on which the reference period begins.
Major modification ã subsequent annual tests
25. (1) Beginning in the year following the year that includes the commissioning date of a class 80 original boiler or heater or a class 70 original boiler or heater, with a major modification, a responsible person for that boiler or heater must determine its emission-intensity by means of
- (a) a subsequent annual test referred to in paragraph 22(a) or (b), if the boiler or heater has a rated capacity of greater than 105 GJ/hr and less than or equal to 262.5 GJ/hr; and
- (b) a subsequent annual test referred to in section 23, if the boiler or heater has a rated capacity of greater than 262.5 GJ/hr.
classes 80 and 70 without major modification
(2) A responsible person for a class 80 original boiler or heater or a class 70 original boiler or heater that has not had a major modification must determine its emission-intensity by means of an annual test referred to in, as the case may be, paragraph (1)(a) or (b) beginning in
- (a) 2026, for a class 80 original boiler or heater; and
- (b) 2036, for a class 70 original boiler or heater.
Change tests ã type of gas or preheated air
26. (1) A responsible person for a boiler or heater who has been required under sections 19 to 22 to conduct an initial test must ã if the type of gaseous fossil fuel combusted is changed or, for a heater, if a change whereby equipment to preheat air is added ã determine the emission-intensity of the boiler or heater by means of one of the following change tests:
- (a) a stack test conducted in accordance with sections 14 to 17 under conditions in which at least 50% of the input energy in its combustion chamber comes from gaseous fossil fuel; or
- (b) the use of a CEMS ã for those hours during which at least 50% of the input energy in its combustion chamber comes from gaseous fossil fuel ã during the reference period, with the result of the CEMS test being
- (i) if there are at least 720 of those hours in the reference period, the greatest rolling hourly average among the rolling hourly averages, determined in accordance with subsection 18(1), for each period consisting of 720 of those hours in the reference period, and
- (ii) if there are less than 720 of those hours in the reference period, the rolling hourly average, determined in accordance with subsection 18(2), for the final hour of those hours.
Class 80 boiler or heater
(2) Subsection (1) does not apply in respect of a class 80 original boiler or heater.
Completion of test
(3) The change test must be completed within 31 days after the day on which the change was made.
Reference period
(4) The reference period begins on the day following the day on which the change was made and ends 31 days after that day.
Information ã Schedule 3
(5) A responsible person for a boiler or heater that has a rated capacity of less than or equal to 105 GJ/hr must ã within 31 days after, as the case may be, the day on which the change test was conducted or the end of reference period ã send a change report to the Minister that contains the information set out in Schedule 3.
MAINTENANCE, OPERATION AND DESIGN
Specifications
27. The responsible person for a boiler or heater must maintain and operate it in accordance with the specifications set out by its manufacturer or required by its design.
Modern boilers and heaters
28. A responsible person for a modern boiler or heater that has a rated capacity of greater than 262.5 GJ/hr must ensure that the boiler or heater is designed to have, for any conditions under which it operates, a maximum emission-intensity of
- (a) 13 g/GJ, for a modern boiler; and
- (b) 16 g/GJ, for a modern heater.
REPORTING
Initial report
29. A responsible person for a boiler or heater must send an initial report to the Minister that contains the information set out in Schedule 4
- (a) by June 1 of the year following the year that includes its commissioning date, for a modern or transitional boiler or heater; and
- (b) by June 1 of the year following the year in which the initial test was conducted under section 21, for an original boiler or heater.
Annual report
30. (1) A responsible person for a boiler or heater that has a rated capacity of greater than 105 GJ/hr must send a first annual report to the Minister that contains the information, in respect of the following periods, set out in Schedule 3:
- (a) for a modern or transitional boiler or heater, on or before June 1 of the year following the year in which the initial report is sent, in respect of that year;
- (b) for a class 80 original boiler or heater or a class 70 original boiler or heater referred to in subsection 8(1), on or before June 1 of the year following the year that includes the commissioning date of the boiler or heater with the major modification in question, in respect of that year; and
- (c) in any other case,
- (i) on or before June 1, 2027, in respect of 2026, for a class 80 original boiler or heater, and
- (ii) on or before June 1, 2037, in respect of 2036, for a class 70 original boiler or heater.
Subsequent annual reports
(2) On or before June 1 of every subsequent year, the responsible person for the boiler or heater must send an annual report to the Minister that contains the information set out in Schedule 3 in respect of the previous year.
Change of information
31. If the information provided in an initial report or an annual report changes, the responsible person must send a notice to the Minister that provides the updated information no later than 31 days after the change.
RECORDING OF INFORMATION
Record-making
32. A responsible person for a boiler or heater must make a record that contains the following information:
- (a) a description of the steps, including the relevant dates, taken to comply with the operation and maintenance specifications for the boiler or heater set out by its manufacturer or required by its design;
- (b) a description, including the relevant dates, of any modifications to the design or characteristics of the boiler and heater, including
- (i) a major modification referred to in subsection 8(2),
- (ii) for a heater, the addition or removal of equipment to preheat air,
- (iii) the refurbishment of a burner, and
- (iv) a modification that results in a change to its thermal efficiency; and
- (c) a change of fuel from alternative gas to natural gas, or vice versa, including the date of the change.
PART 2
STATIONARY SPARK-IGNITION ENGINES
INTERPRETATION
Definitions
33. (1) The following definitions apply in this Part and in Schedules 5 and 6.
ãASTM D6348-12ã
ô¨ mûˋthode ASTM D6348-12ô ô£
ãASTM D6348-12ã means the method ASTM D6348-12 entitled Standard Test Method for Determination of Gaseous Compounds by Extractive Direct Interface Fourier Transform Infrared (FTIR) Spectroscopy, published by ASTM.
ãemergencyã
ô¨ urgenceô ô£
ãemergencyã, in relation to the operation of an engine, means a period during which the engine is operated
- (a) to produce electricity as an alternative source of electrical power when no ordinary source is available; or
- (b) to pump water when required due to a fire or a flood.
ãemission-intensityã
ô¨ intensitûˋ dãûˋmissionô ô£
ãemission-intensityã means the quantity of NOx emitted in the exhaust gas of an engine expressed as
- (a) the concentration of NOx in the exhaust gas, expressed in ppmvd; or
- (b) the mass of NOx in the exhaust gas per unit of output of mechanical energy or of electrical energy, expressed in g/kWh.
ãEPA Method 1ã
ô¨ mûˋthode 1 de lãEPAô ô£
ãEPA Method 1ã means the method entitled Method 1 ã Sample and Velocity Traverses for Stationary Sources, set out in Appendix A-1 of Part 60 of the CFR.
ãEPA Method 1Aã
ô¨ mûˋthode 1A de lãEPAô ô£
ãEPA Method 1Aã means the method entitled Method 1A ã Sample and Velocity Traverses for Stationary Sources With Small Stacks or Ducts, set out in Appendix A-1 of Part 60 of the CFR.
ãEPA Method 2ã
ô¨ mûˋthode 2 de lãEPAô ô£
ãEPA Method 2ã means the method entitled Method 2 ã Determination of Stack Gas Velocity and Volumetric Flow Rate (Type S pitot tube), set out in Appendix A-1 of Part 60 of the CFR.
ãEPA Method 3ã
ô¨ mûˋthode 3 de lãEPAô ô£
ãEPA Method 3ã means the method entitled Method 3 ã Gas Analysis for the Determination of Dry Molecular Weight, set out in Appendix A-2 of Part 60 of the CFR.
ãEPA Method 3Bã
ô¨ mûˋthode 3B de lãEPAô ô£
ãEPA Method 3Bã means the method entitled Method 3B ã Gas Analysis for the Determination of Emission Rate Correction Factor or Excess Air, set out in Appendix A-2 of Part 60 of the CFR.
ãEPA Method 7ã
ô¨ mûˋthode 7 de lãEPAô ô£
ãEPA Method 7ã means the method entitled Method 7 ã Determination of Nitrogen Oxide Emissions from Stationary Sources, set out in Appendix A-4 of Part 60 of the CFR.
ãEPA Method 7Aã
ô¨ mûˋthode 7A de lãEPAô ô£
ãEPA Method 7Aã means the method entitled Method 7A ã Determination of Nitrogen Oxide Emissions from Stationary Sources ã Ion Chromatographic Method, set out in Appendix A-4 of Part 60 of the CFR.
ãEPA Method 7Cã
ô¨ mûˋthode 7C de lãEPAô ô£
ãEPA Method 7Cã means the method entitled Method 7C ã Determination of Nitrogen Oxide Emissions from Stationary Sources ã Alkaline-Permanganate/Colorimetric Method, set out in Appendix A-4 of Part 60 of the CFR.
ãEPA Method 19ã
ô¨ mûˋthode 19 de lãEPAô ô£
ãEPA Method 19ã means the method entitled Method 19 ã Determination of Sulfur Dioxide Removal Efficiency and Particulate, Sulfur Dioxide and Nitrogen Oxides Emission Rates, set out in Appendix A-7 of Part 60 of the CFR.
ãEPA Method 320ã
ô¨ mûˋthode 320 de lãEPAô ô£
ãEPA Method 320ã means the method entitled Method 320 ã Measurement of Vapor Phase Organic and Inorganic Emissions by Extractive Fourier Transform Infrared (FTIR) Spectroscopy, set out in Appendix A of Part 63 of the CFR.
ãgroupã
ô¨ groupeô ô£
ãgroupã means the engines designated under section 39 as belonging to a responsible personãs group and, for the purpose of section 42 includes replacement units referred to in section 43 and modern replacement engines referred to in section 44.
ãlean-burnã
ô¨ û mûˋlange pauvreô ô£
ãlean-burnã, in relation to an engine, means an engine other than a rich-burn engine.
ãlow-useã
ô¨ û faible utilisationô ô£
ãlow-useã, in relation to an engine, means an engine in respect of which an election made under subsection 36(2) remains in effect.
ãmodernã
ô¨ moderneô ô£
ãmodernã, in relation to an engine, means an engine other than an original engine.
ãoriginalã
ô¨ dãorigineô ô£
ãoriginalã, in relation to an engine, means an engine that was manufactured before January 1, 2015 as established by
- (a) a document provided by its manufacturer that sets out its serial number and its date of manufacture as before January 1, 2015, if that document is accessible to a responsible person for the engine; or
- (b) any other document provided by its manufacturer or a government body that sets out its serial number and establishes that the engineãs manufacture was completed on a date before January 1, 2015, in any other case.
ãppmvdã
ô¨ ppmvsô ô£
ãppmvdã means parts per million, on a volumetric dry basis adjusted to 15% oxygen dry.
ãrated brake powerã
ô¨ puissance au frein nominaleô ô£
ãrated brake powerã, in relation to an engine or a replacement unit, means its maximum brake power output
- (a) as specified on the nameplate provided by its manufacturer; or
- (b) in the absence of such a nameplate, as set out in a document, which indicates its serial number, provided by its manufacturer or a government body.
ãrich-burnã
ô¨ û mûˋlange richeô ô£
ãrich-burnã, in relation to an engine, means a four-stroke spark ignition engine for which the excess oxygen content in the exhaust gas, without dilution, is less than four percent, when the engine is operated at 90% or more of its rated brake power.
ãstill gasã
ô¨ gaz de distillationô ô£
ãstill gasã means a gas produced in a refinery by distillation, cracking or reforming.
ãsubgroupã
ô¨ sous-groupeô ô£
ãsubgroupã, in relation to a responsible personãs group, means a notional collection of engines ã which includes any replacement units and modern replacement engines ã established under section 46, each of which belongs to the group.
ãsubsetã
ô¨ sous-ensembleô ô£
ãsubsetã, in relation to a responsible personãs group, means a notional collection of engines referred to in section 41, each of which belongs to the group.
ãsynthetic gasã
ô¨ gaz de synthû´seô ô£
ãsynthetic gasã means a gas derived from the gasification of coal or of by-products, residual products or waste products of an industrial process.
Presumed rich-burn engines
(2) An engine that is designated by its manufacturer as a rich-burn engine is presumed to be a rich-burn engine.
Rebuttal ã lean-burn engines
(3) The presumption is rebutted if the responsible person for the engine establishes that when the engine is operated at 90% or more of its rated brake power, the excess oxygen content in the exhaust gas, without dilution, is greater than or equal to four percent, in which case the engine is a lean-burn engine.
APPLICATION
Original and modern engines
34. (1) This Part applies in respect of an original or a modern engine, in a regulated facility, that combusts gaseous fuel.
Regulated facilities ã modern engines
(2) The following are the regulated facilities in respect of modern engines:
- (a) oil and gas facilities;
- (b) oil sands facilities;
- (c) petroleum refineries;
- (d) chemicals facilities and nitrogen fertilizer facilities;
- (e) pulp and paper facilities;
- (f) base metals facilities;
- (g) potash facilities;
- (h) alumina facilities and aluminium facilities;
- (i) power plants;
- (j) iron, steel and ilmenite facilities;
- (k) iron ore pelletizing facilities; and
- (l) cement manufacturing facilities.
Regulated facilities ã original engines
(3) Oil and gas facilities are the regulated facilities in respect of original engines.
OBLIGATIONS
Scope of Application ã Gas Combusted
Synthetic and still gas
35. Section 38, subsection 39(2), sections 40 and 41, subsection 47(2) and sections 58 and 59 do not apply in respect of an engine ã for any period during which the fuel combusted consists of more than 50% of synthetic gas, still gas or any combination of those gases ã if the responsible person for the engine establishes, based on a calculation of the mass-flow, that the fuel combusted consists of that portion of those gases.
Use of Engines
Regular-use
36. (1) Every engine that has been operated by its responsible person for an hour during a year is a regular-use engine unless the responsible person elects to have it considered to be a low-use engine.
Notice ã low-use engine
(2) The responsible person must make the election by sending a notice to that effect to the Minister
- (a) by January 1 of the year as of which the engine is to be considered to be low-use, if the engine is a regular-use engine of the responsible person; and
- (b) by the day on which the responsible person begins to operate the engine, in any other case.
Obligation ã low-use engines
(3) The responsible person must
- (a) by the January 1 referred to in paragraph (2)(a) or by the day referred to in paragraph (2)(b), as the case may be, have installed a non-resettable hour meter or another non-resettable device to record the number of hours that the engine is operated and ensure that the meter or device operates continuously; and
- (b) for the period of three consecutive years that begins, as the case may be, on the January 1 referred to in paragraph (2)(a) or the January 1 of the year that includes the day referred to in paragraph (2)(b) ã and for each subsequent period of three consecutive years ã ensure that the engine is operated, excluding any hours of operation during an emergency, for less than 1314 hours, as determined by the absolute difference between the first and last readings taken under section 57 for each of those periods.
Revocation
(4) A responsible person for the engine may revoke the election by sending a notice of revocation to the Minister.
Contravention of subsection (3)
(5) If a responsible person contravenes subsection (3), the election is revoked and the engine is a regular-use engine.
Single election
(6) A responsible person may, under subsection (2), elect only once to have a given engine considered to be a low-use engine.
Expression of Emission-intensity
ppmvd or g/kWh
37. For the purposes of subsection 38(1), subsection 39(2), sections 40 and 41 and subsections 42(1) and 47(2), the emission-intensity of an engine and the emission-value assigned to an engine are to be expressed in ppmvd or g/kWh according to the units chosen by the responsible person to express the emission-intensity as determined by their most recent performance test under section 53.
Modern Engines
Regular-use
38. (1) A responsible person for a modern engine that is regular-use and has a rated brake power of greater than or equal to 75 kW must ensure that the emission-intensity of the engine, as determined in accordance with sections 48 to 52, does not exceed the following limit, as applicable:
- (a) 160 ppmvd; or
- (b) 2.7 g/kWh.
Low-use
(2) A responsible person for a modern engine that is low-use and has a rated brake power of greater than or equal to 100 kW must ensure that the emission-intensity of the engine, as determined in accordance with sections 48 to 52, does not exceed the limit of 160 ppmvd.
Original Engines
Groups
Designation
39. (1) For the purposes of the emission-intensity limits referred to in sections 40 to 42, a responsible person may ã from among their original engines that are regular-use and have a rated brake power of greater than or equal to 250 kW ã designate those engines that are to belong to their group by recording the serial number of each engine designated and the date of the designation.
Non-designated engines
(2) A responsible person for an engine referred to in subsection (1) that is not designated as belonging to any group must ensure that the emission-intensity of the engine, as determined in accordance with sections 48 to 52, does not exceed one of the following limits, as applicable:
- (a) 210 ppmvd; or
- (b) 4 g/kWh.
Application
(3) Subsection (2) applies as of January 1, 2021.
Deemed non-designation
(4) An engine that has been designated as belonging to more than one responsible personãs group is deemed not to belong to any responsible personãs group.
Ceases to belong
(5) An engine belonging to a responsible personãs group ceases to belong to the group if
- (a) the engine ceases to be a regular-use engine; or
- (b) the responsible person cancels its designation as belonging to their group by recording the serial number of the engine and the date of the cancellation.
Default Obligations
Original engines ã as of 2026
40. As of January 1, 2026, a responsible person for an engine that belongs to their group must ensure that the emission-intensity of the engine, as determined in accordance with sections 48 to 52, does not exceed the following limit, as applicable:
- (a) 210 ppmvd; or
- (b) 4 g/kWh.
Original engines ã obligation 2021 to 2025
41. (1) In the period that begins on January 1, 2021 and ends on December 31, 2025, a responsible person for engines that belong to their group must ensure that there is a subset of the group whose total rated brake power is at least 50% of the total rated brake power of the group and the emission-intensity, as determined in accordance with sections 48 to 52, of each of the engines in the subset does not exceed the following limit, as applicable:
- (a) 210 ppmvd; or
- (b) 4 g/kWh.
Engine ceasing to belong to group
(2) For the purpose of subsection (1), despite an engineãs ceasing to belong to the group, its rated brake power may be included in the total rated brake power of the group and of a subset whose total rated brake power is at least 50% of the total rated brake power of the group.
Obligations on Election
Original engines ã yearly average
42. (1) A responsible person for engines that belong to their group, who elects to comply with this subsection, must ensure that ã for each year after 2020 following the making of the election ã the yearly average emission-intensity of each subgroup established under section 46 does not exceed the following limits, as applicable:
- (a) 210 ppmvd or 4 g/kWh, for years after 2025; or
- (b) 421 ppmvd or 8 g/kWh, for the years 2021 to 2025.
Election
(2) The responsible person must ã by the October 31 immediately before the first year in respect of which the applicable limit in paragraph (1)(a) or (b) is to apply ã make the election by sending, for each subgroup established under section 46, the following information to the Minister for inclusion in the engine registry:
- (a) the serial number of each original engine, replacement unit and modern replacement engine belonging to the subgroup; and
- (b) the emission-value assigned, under section 47, to each original engine, replacement unit and modern replacement engine belonging to the subgroup.
Non-application of section 40 or 41
(3) As of that first year, sections 40 and 41 do not apply in respect of the engines that are in their group.
Yearly average emission-intensity
(4) The yearly average emission-intensity of a subgroup for the year in question is determined ã using the same units, ppmvd or g/kWh, for the assigned emission-value in respect of each original engine, replacement unit or modern replacement engine belonging to the subgroup ã by using the formula
öÈiöÈj(Eij ûPi û Hij)/öÈiöÈj(Pi û Hij)
- where
- Eijô is the jth emission-value assigned under section 47 to the ith engine or replacement unit belonging to the subgroup;
- Piô is the rated brake power, expressed in kW, of the ith engine or replacement unit belonging to the subgroup;
- Hijô is the number of hours during the year in question that the ith engine or replacement unit operated while belonging to the subgroup and having an assigned emission-value Eij;
- iô is the ith engine or replacement unit belonging to the subgroup, where i goes from 1 to m and where m is the number of those engines and replacement units in the subgroup; and
- jô is the jth assignment under section 47 of an emission-value to the ith engine or replacement unit belonging to the subgroup, where j goes from 1 to n and where n is the number of assignments of emission-values under section 47 to that engine or replacement unit during the year.
Number of hours
(5) The number of hours referred to in the description of Hij in subsection (4) is to be determined by adding the following, as applicable:
- (a) the absolute difference between the first and last readings taken under section 56 during the year in question while the ith engine or replacement unit operated having an assigned emission-value Eij;
- (b) subject to subsection (6), the number of hours of operation in the year in question before the first of those two readings, determined by using the formula
(R1(y) ã R2(yã1)) û dR1(y)/(dR1(y) + dR2(yã1))
- where
- R1(y)ô is the first of the readings taken under section 56 in the year in question, while the ith engine or replacement unit operated having an assigned emissionvalue Eij;
- R2(yã1)ô is the last of the readings taken under section 56 in the year previous to the year in question, while the ith engine or replacement unit operated having an assigned emission-value Eij;
- dR1(y)ô is the number of days in the given year before that first reading, and
- dR2(yã1)ô is the number of days in the previous year after that last reading; and
- (c) the number of hours of operation in the year in question after the last of the two readings referred to in paragraph (a), determined by using the formula
(R2(y) ã R1(y+1)) û dR2(y)/(dR2(y) + dR1(y+1))
- where
- R2(y) is the last of the readings taken under section 56 in the year in question, while the ith engine or replacement unit operated having an assigned emissionvalue Eij,
- R1(y+1)ô is the first of the readings taken under section 56 in the year that follows the year in question, while the ith engine or replacement unit operated having an assigned emission-value Eij,
- dR2(y)ô is the number of days in the year in question after that last reading, and
- dR1(y+1)ô is the number of days in the following year before that first reading.
Estimate in first year
(6) For the first year in respect of which the applicable limit in paragraph (1)(a) or (b) applies and for the period before the first reading taken under section 56 in that year, the responsible person must estimate the number of hours of operation while the ith engine or replacement unit operated having an assigned emission-value Eij. The responsible person must make a record that sets out the basis for the estimate, along with a justification of its accuracy.
Cancellation
(7) A responsible person may cancel their election by sending the Minister, by October 31 of a year, a notice of cancellation that provides that information for inclusion in the engine registry. As of the year that begins following the notification, the limit in paragraph (1)(a) or (b) that was applicable ceases to apply and sections 40 and 41 apply to the responsible person in respect of the engines in their group.
Revocation
(8) The election of a responsible person who is convicted of an offence under the Act in respect of these Regulations is revoked as of the year that begins 36 months following their conviction. As of that year,
- (a) the limit in paragraphs (1)(a) and (b) that was applicable ceases to apply;
- (b) sections 40 and 41 apply to the responsible person in respect of the engines in their group; and
- (c) the responsible person is not permitted to make an election under subsection (2).
Replacement units
43. (1) One or more original engines that cease to belong to a responsible personãs group may, within 12 months after the day on which that cessation takes effect, be replaced by an eligible replacement unit.
Eligible replacement units
(2) Each of the following is an eligible replacement unit:
- (a) an electric motor; and
- (b) a turbine that is equipped with an emission control system that ensures that its emission-intensity does not exceed the following limits, as applicable:
- (i) 100 ppmvd or 1.8 g/kWh, for a turbine having a rated brake power of less than 3 MW,
- (ii) 42 ppmvd or 0.9 g/kWh, for a turbine having a rated brake power of greater than or equal to 3 MW and less than or equal to 20 MW, and
- (iii) 25 ppmvd or 0.5 g/kWh, for a turbine having a rated brake power of greater than 20 MW.
Modern replacement engines
44. One or more original engines that cease to belong to a responsible personãs group may, within 12 months after the day on which that cessation takes effect, be replaced by one or more modern replacement engines that together have a total rated brake power that is less than or equal to the total rated brake power of the original engine or engines to be replaced.
When replacement occurs
45. (1) The replacement takes effect on the day on which the responsible person sends to the Minister the following information for inclusion in the engine registry:
- (a) the date of the replacement;
- (b) the serial number of the engine being replaced; and
- (c) the information set out in Schedule 5 for inclusion in the engine registry in respect of
- (i) the engine being replaced and of the replacement unit or modern replacement engines, if the replacement occurs before January 1, 2018, and
- (ii) the replacement unit or modern replacement engines, if the replacement occurs on or after January 1, 2018.
When information sent
(2) The information must be sent within the 12-month period referred to in subsection 43(1) or section 44.
Reintroduction of replaced engines
(3) An original engine that has been replaced under section 43 or 44 may be reintroduced into the responsible personãs group if, as the case may be,
- (a) the replacement unit that replaced it is removed from the group; or
- (b) from among the modern replacement engine or engines that replaced it, modern replacement engines ã having a total rated brake power that is equal to or greater than the rated brake power of the original engine ã are removed from the group.
Designation of subgroups
46. (1) On making the election referred to in subsection 42(2), the responsible person must establish their subgroups by designating the original engines, replacement units and modern replacement engines that are to belong to each subgroup and by recording each of their serial numbers and the date of the designation.
Engines in subgroups
(2) Every original engine, replacement unit and modern replacement engine belonging to a group must be included in exactly one subgroup.
Engine registry
(3) For each subgroup, the responsible person must, by July 1 of the year that follows the designation, send to the Minister for inclusion in the engine registry the serial number of each original engine, replacement unit and modern replacement engine that belongs to it, along with the date of the designation.
Change of subgroups
(4) The number of subgroups or their composition may be changed by recording the updated information, including the date of the change.
Assignment of emission-value for NOx
47. (1) A responsible person for a group must assign an emission-value for NOx, expressed in ppmvd or g/kWh, as applicable, to each original engine, replacement unit or modern replacement engine belonging to each subgroup.
Different emission-values
(2) If the responsible person assigns an emission-value to an engine that is different from the default emission-value for the engine, the responsible person must ensure that the emission-intensity of the engine, as determined in accordance with sections 48 to 52, is less than or equal to its assigned emission-value.
Replacement units
(3) The responsible person must assign the default emission-value to a replacement unit, expressed in the units, ppmvd or g/kWh, applicable to the subgroup to which it belongs.
Default emission-intensities
(4) The default emission-value is
- (a) for an original two-stroke lean-burn engine, 841 ppmvd or 16 g/kWh;
- (b) for an original four-stroke lean-burn engine with an excess oxygen content in the exhaust gas, without dilution, when the engine is operating at a steady-state that is greater than or equal to seven percent, 210 ppmvd or 4g/kWh;
- (c) for an original four-stroke lean-burn engine with an excess oxygen content in the exhaust gas, without dilution, less than seven percent, 710 ppmvd or 13.5g/kWh;
- (d) for an original four-stroke rich-burn engine, 1262 ppmvd or 24 g/kWh;
- (e) for a modern replacement engine, 210 ppmvd or 2.7 g/kWh;
- (f) for a replacement unit that is an electric motor, 0 ppmvd or 0 g/kWh; and
- (g) for a replacement unit that is a turbine having a rated brake power of
- (i) less than 3 MW, 100 ppmvd or 1.8 g/kWh,
- (ii) greater than or equal to 3 MW and less than or equal to 20 MW, 42 ppmvd or 0.9 g/kWh, and
- (iii) greater than 20 MW, 25 ppmvd or 0.5 g/kWh.
Change of assignment
(5) A responsible person is permitted to change an assigned emission-value for an engine. The change takes effect on the day on which the responsible person sends the changed assignment to the Minister for inclusion in the engine registry.
DETERMINATION OF EMISSION-INTENSITY
Performance tests
48. (1) A performance test consists of three consecutive test-runs, conducted within 48 hours, of at least 30 minutes each.
Conditions for test-runs
(2) Each test-run must be conducted while the engine is operating
- (a) at the lower of
- (i) 90% or more of its rated brake power, and
- (ii) its highest achievable brake power for the operating conditions during the test-run; and
- (b) at a steady-state.
Sampling ports
49. (1) The sampling port and the number of traverse points in the exhaust manifold for each test-run is to be determined using
- (a) EPA method 1 or EPA method 1A, or both; or
- (b) ASTM D6522-11.
Original engines without sampling port
(2) If an original engine does not have a sampling port that complies with that subsection, each test-run to determine the emission-intensity of the engine is to be conducted using a single traverse point in the exhaust manifold and the results of the test-run are to be expressed in ppmvd.
After-treatment control devices
(3) If an after-treatment control device is used, the sampling port is to be located downstream of the device.
Concentration of NOx
50. (1) The concentration of NOx in the engineãs exhaust gas is to be determined in accordance with
- (a) EPA Method 7;
- (b) EPA Method 7A;
- (c) EPA Method 7C;
- (d) EPA Method 7E;
- (e) EPA Method 320;
- (f) ASTM D6348-12; or
- (g) ASTM D6522-11.
Concentration of O2
(2) The concentration of O2 in the engineãs exhaust gas is to be determined in accordance with
- (a) EPA Method 3;
- (b) EPA Method 3A;
- (c) EPA Method 3B;
- (d) ASTM D6522-11; or
- (e) the method entitled Flue and Exhaust Gas Analyses published by the American Society of Mechanical Engineers and cited as ASME PTC 19.10ã1981.
Simultaneous measurement
(3) During each test-run, the concentration of NOx in the engineãs exhaust gas, the concentration of O2 in the engineãs exhaust gas and ã if that concentration of NOx is not measured on a dry basis or if the emission-intensity is expressed in g/kWh ã the moisture content in the engineãs exhaust gas must be measured simultaneously at the same traverse point in the exhaust manifold.
Volumetric flow rate
(4) The volumetric flow rate of the engineãs exhaust gas, if the responsible person chose to express its emission-intensity in g/kWh under section 53, must be determined in accordance with EPA Method 2 or EPA Method 19, expressed in m3/hr, at 25ô¯C and 101.325 kPa.
ppmvd
51. (1) The emission-intensity, if expressed in ppmvd, for each test-run of an engine is determined in accordance by using the formula
5.9E/(20.9 ãô %O2)
- where
- Eô is the concentration of NOx, as determined in accordance with subsection 50(1), in the engineãs exhaust gas in parts per million by volume measured on a dry basis at a given percentage of oxygen (%O2); and
- %O2ô is the number that represents the percentage of oxygen, on a dry volumetric basis, in the engineãs exhaust gas, based on the concentration of O2 determined in accordance with subsection 50(2).
g/kWh
(2) The emission-intensity, if expressed in g/kWh, for each test-run of an engine is determined by using the formula
(1.88 û 10-3 û E û R û T)/BW
- where
- Eô is the concentration of NOx, as determined in accordance with subsection 50(1), in the engineãs exhaust gas in parts per million by volume measured on a dry basis at a given percentage of oxygen (%O2);
- Rô is the dry volumetric flow rate of the engineãs exhaust gas, determined in accordance with subsection 50(4);
- Tô is the duration of the test-run, expressed in hours to two decimal places; and
- BWô is the brake work of the engine during the test-run, expressed in kWh.
Emission-intensity average
52. The average of the emission-intensity results for each of the three test-runs determines the emission-intensity of the engine.
Initial performance test
53. (1) A responsible person for the following regular-use engines must conduct an initial performance test to determine the enginesã emission-intensity, expressed at their option in ppmvd or g/kWh:
- (a) within the first year of its operation, in the case of a modern engine;
- (b) within the first year of the application of section 41, in the case of a rich-burn original engine that belongs to the subset referred to in subsection 41(1);
- (c) within the first year of the application of section 40, in the case of a rich-burn original engine other than one referred to in paragraph (b); and
- (d) within the first year after each assignment of an emission-value to the engine that is different from the default emission-value for the engine.
Subsequent performance tests
(2) A responsible person for a regular-use engine with a rated brake power of greater than or equal to 375 kW for which an initial performance test has been conducted must conduct subsequent performance tests to determine its emission-intensity, expressed at their option in ppmvd or g/kWh, at the following frequency:
- (a) by the earlier of 17 520 hours of operation and 36 months since its previous performance test, for a lean-burn engine; and
- (b) by the earlier of 4 380 hours of operation and nine months since its previous performance test, for a rich-burn engine.
DETERMINATION OF O2 CONCENTRATION
Lean burn engines
54. A responsible person for the following regular-use engines must, once a year but at least six months after a previous determination, determine the percentage of oxygen, on a dry volumetric basis, in the engineãs exhaust gas, without dilution:
- (a) modern lean-burn engines with a rated brake power greater than or equal to 375 kW;
- (b) original lean-burn engines that are subject to an emission-intensity limit under section 40 or 41; and
- (c) original four-stroke lean-burn engines for which the default emission-intensity referred to in paragraph 47(4)(b) or (c) has been assigned under subsection 47(1).
OPERATION AND MAINTENANCE
Hours of operation ã measurement
55. A responsible person for any of the following engines and replacement units must, on a continuous basis, measure the number of hours it operates by means of a non-resettable hour meter or another non-resettable device:
- (a) an original engine, replacement unit or modern replacement engine that belongs to a group for which the responsible person made an election under subsection 42(2); and
- (b) a low-use engine.
Hours of operation ã election under subsection 42(2)
56. (1) A responsible person who makes an election under subsection 42(2) must take a reading of the non-resettable hour meter or other non-resettable device for an original engine, replacement unit or modern replacement engine that belongs to their group within 48 hours after
- (a) a change is made to the emission-value assigned, under section 47, to the engine;
- (b) the engine or replacement unit is added to a subgroup; and
- (c) the engine or replacement unit ceases to belong to the group.
Two readings per year
(2) The responsible person must, during each year, take two readings, at least six months apart, of the non-resettable hour meter or other non-resettable device for each original engine, replacement unit or modern replacement engine that belongs to their group.
Hours of operation ã readings for low-use engines
57. A responsible person for a low-use engine must take a reading of the non-resettable hour meter or other non-resettable device for the engine,
- (a) for the initial reading, as the case may be,
- (i) in January of the year referred to in paragraph 36(2)(a), or
- (ii) on the day referred to in paragraph 36(2)(b);
- (b) for the second reading, as the case may be, in December of the year
- (i) referred to in subparagraph (a)(i), or
- (ii) in which the day described in subparagraph (a)(ii) occurred; and
- (c) for subsequent readings, in every subsequent January and December from then on.
Operation and maintenance
58. (1) Subject to subsection (2), a responsible person for an engine ã other than an original engine that has been assigned its default emission-value under subsection 47(1) ã must comply with the operation and maintenance recommendations of the manufacturer for the following systems and components related to the engine, as applicable:
- (a) the ignition system, including spark plugs;
- (b) the air/fuel ratio management system;
- (c) the NOx, O2 and lambda sensors;
- (d) the oil and oil filters;
- (e) the intake air filtration system; and
- (f) the after-treatment control device.
Non-compliance with recommendations
(2) The responsible person is not required to comply with all of those recommendations when they expect, based on their evaluation, that without that compliance the emission-intensity of the engine will not exceed, as applicable, the following:
- (a) the emission-value assigned to the engine under subsection 47(1), if the responsible person has made an election referred to in subsection 42(2) that remains in effect and that assigned emission-value is different from its default emission-value;
- (b) the applicable emission-intensity limit under section 38 or 40;
- (c) for an engine that belongs to the subset referred to in subsection 41(1), the applicable emission-intensity limit under that subsection; and
- (d) for an engine referred to in subsection 39(1) that has not, as of January 1, 2021, been designated as belonging to any responsible personãs group, the applicable emission-intensity limit under subsection 39(2).
Air/fuel ratio
59. A responsible person for an engine referred to in subsection 58(1) must verify, maintain and adjust the air/fuel ratio of the engine so as to ensure that its emission-intensity, during the diverse ambient conditions anticipated during a year, does not exceed, as applicable, the following:
- (a) the emission-value assigned to the engine under subsection 47(1), if the responsible person has made an election referred to in subsection 42(2) that remains in effect and that assigned emission-value is different from its default emission-value;
- (b) the applicable emission-intensity limit under section 38 or 40;
- (c) for an engine that belongs to the subset referred to in subsection 41(1), the applicable emission-intensity limit under that subsection; and
- (d) for an engine referred to in subsection 39(1) that has not, as of January 1, 2021, been designated as belonging to any responsible personãs group, the applicable emission-intensity limit under subsection 39(2).
REGISTRY, REPORTING AND RECORDING OF INFORMATION
Engine registry
60. (1) The Minister is to establish an engine registry for the purpose of facilitating the administration of, and encouraging compliance with, these Regulations.
Regular-use and low-use engines
(2) The following engines must be registered in the engine registry by one of the responsible persons for the engine:
- (a) a modern engine that is regular-use with a rated brake power greater than or equal to 75 kW;
- (b) a modern engine that is low-use with a rated brake power greater than or equal to 100 kW; and
- (c) an original engine that is regular-use or low-use with a rated brake power greater than or equal to 250 kW.
Registration
(3) The registration occurs when a responsible person for the engine sends to the Minister the information in respect of the engine set out in Schedule 5 for inclusion in the engine registry.
Date of registration
(4) The registration, for engines that do not belong to a group, must be completed
- (a) by January 1, 2018, for an original engine that is regular-use or low-use with a rated brake power greater than or equal to 250 kW; and
- (b) by the July 1 that follows the year during which the engine began to operate,
- (i) for a modern engine that is regular-use with a rated brake power greater than or equal to 75 kW, and
- (ii) for a modern engine that is low-use with a rated brake power greater than or equal to 100 kW.
Registration
61. (1) A responsible person for engines that belong to their group must register each of the engines that belong to their group.
Date of registration
(2) The registration must be completed
- (a) by January 1, 2018, for an original engine that is designated as belonging to the group before that date; and
- (b) by the July 1 that follows the year during which the engine is designated as belonging to the group, for an original engine that is designated to belong to a group on or after January 1, 2018.
Change of information
62. If the information sent for inclusion in the engine registry changes, the responsible person must send the updated information for inclusion in the engine registry to the Minister by the July 1 of the year that follows the year during which the change occurred.
Annual reports
63. A responsible person for an engine must, on or before July 1 of the year that follows the year for which an annual report is made, send an annual report to the Minister that contains the information set out in Schedule 6 in respect of that year.
Record-making
64. A responsible person for an engine or replacement unit must make a record that contains the following information:
- (a) a description of the steps taken to comply with the manufacturerãs operation and maintenance recommendations for the operation and maintenance of the systems and components related to the engine referred to in paragraphs 58(1)(a) to (f);
- (b) a statement indicating, for each of those recommendations that the responsible person did not comply with, their evaluation that forms the basis for an expectation that the emission-intensity of the engine does not exceed the applicable emission-intensity value or limit referred to in subsection 58(2);
- (c) for each engine referred to in subsection 58(1), the type of equipment or method used to control the air/fuel ratio of the engine, and how that ratio was verified and maintained or adjusted, during the diverse ambient conditions in each year, so as to ensure that its emission-intensity does not exceed, as applicable, the emission-intensity limit or emission-value referred to in section 59.
- (d) if any, the results of each determination made in accordance with section 54 and the date of that determination;
- (e) for each initial performance test referred to in subsection 53(1) and each subsequent performance test referred to in subsection 53(2) conducted on an engine referred to in those subsections,
- (i) the date on which the performance test was conducted,
- (ii) the name of the person who conducted the performance test and, if that person is a corporate body, the name of the individual who conducted the performance test, and
- (iii) for each test-run that comprised the performance test,
- (A) the brake power at which the test-run was conducted and the measurements and calculations used to determine that brake power, and
- (B) the emission-intensity of the engine determined from that test-run and the measurements and calculations used to determine the emission-intensity of the engine;
- (f) if any, the results of each reading of a non-resettable hour meter or other non-resettable device, as the case may be, referred to in section 56 or 57;
- (g) for each low-use engine, if applicable, the duration, expressed in whole hours, during which the engine operated during an emergency;
- (h) the calculation of the mass-flow referred to in section 35;
- (i) for each engine designated as belonging to their group, the serial number of the engine and the date of the designation referred to in subsection 39(1);
- (j) for each engine for which the responsible person cancels its designation as belonging to their group, the serial number of the engine and the date of the cancellation referred to in paragraph 39(5)(b);
- (k) for each original engine with a rated brake power of greater than or equal to 250 kW that ceases to be a regular-use engine, the serial number of the engine and the date of that cessation;
- (l) the information regarding the designation of the engines and replacement units in their subgroups and any changes to the number of subgroups or their composition referred to in subsections 46(1) and (4); and
- (m) a copy of any notice or report required by these Regulations.
PART 3
CEMENT
Definitions
65. The following definitions apply in this Part and in Schedule 7.
ãcementã
ô¨ô cimentô ô£
ãcementã means a powder that results from the grinding of clinker and the blending of it with other materials.
ãfeedstockã
ô¨ô matiû´re primiû´reô ô£
ãfeedstockã means a ground mixture of calcium carbonate, silica, alumina, ferrous oxide, and any other material, used to produce clinker.
ãgrey cementã
ô¨ô ciment grisô ô£
ãgrey cementã means cement manufactured from clinker containing more than 0.5% by weight of ferrous oxide, which has the molecular formula Fe2O3.
ãkilnã
ô¨ô fourô ô£
ãkilnã means a thermally insulated chamber into which blended feedstock is introduced for pyroprocessing in order to produce clinker.
ãlong dry kilnã
ô¨ô four long û voie sû´cheô ô£
ãlong dry kilnã means a kiln into which dry feedstock is introduced with at most one stage of preheating and without precalcining the feedstock.
ãprecalciner kilnã
ô¨ô four û prûˋcalcinateurô ô£
ãprecalciner kilnã means a kiln into which preheated and precalcined dry feedstock is introduced.
ãpreheater kilnã
ô¨ô four û prûˋchauffeurô ô£
ãpreheater kilnã means a kiln into which preheated dry feedstock is introduced.
ãwet kilnã
ô¨ô four en voie humideô ô£
ãwet kilnã means a kiln into which feedstock is introduced as a fine slurry with a water content greater than 20% by weight.
Application ã grey cement
66. This Part applies in respect of kilns located in cement manufacturing facilities that produce clinker for use in the manufacture of grey cement.
Prohibition
67. (1) A responsible person for a cement manufacturing facility must ensure that the facility does not emit NOx or SO2, during two consecutive years, in a quantity that exceeds the emission limit, as determined in accordance with section 68 or 69, as the case may be, for each of those years.
Prohibition after contravention of subsection (1)
(2) A responsible person for a cement manufacturing facility who contravenes subsection (1) must ensure that the cement manufacturing facility does not emit NOx or SO2, during a given year subsequent to the contravention, in a quantity that exceeds the emission limit as determined in accordance with section 68 or 69, as the case may be, for that given year.
Emission limit ã NOx
68. (1) The emission limit for the emission of NOx from a cement manufacturing facility, for a year, is determined by using the formula
öÈ(EINOxi û Pi)/öÈPi
- where
- EINOxiô is the maximum emission-intensity for the emission of NOx from the ith kiln in the cement manufacturing facility for the year ã namely the maximum quantity of NOx emitted per tonne of clinker produced at the ith kiln in the cement manufacturing facility for the year ã which is, as the case may be
- (a) for preheater kilns and precalciner kilns, 2.25 kg/tonne, and
- (b) for wet kilns and long dry kilns, as elected in accordance with subsection (2),
- (i) 2.55 kg/tonne, or
- (ii) EI2006 ã (0.3 x EI2006), where EI2006 is the quantity of NOx, expressed in kilograms, produced at the cement manufacturing facility in 2006 per tonne of clinker produced, as reported in respect of the cement manufacturing facility to the Minister in accordance with the Notice with respect to reporting of information on air pollutants, greenhouse gases and other substances for the 2006 calendar year published in Part I, Volume 141, No. 49, of the Canada Gazette on December 8, 2007;
- iô is ith kiln in the cement manufacturing facility where i goes from 1 to n and where n is the number of kilns in the cement manufacturing facility; and
- Pi ô is the quantity of clinker, expressed in tonnes, produced by the ith kiln in the cement manufacturing facility for the year.
Election
(2) The responsible person for the cement manufacturing facility must make the election in their annual report referred to in section 72 in respect of the year 2017.
Election applies in subsequent years
(3) The maximum emission-intensity elected by the responsible person in respect of the year 2017 also applies in respect of subsequent years.
Emission limit ã SO2
69. The emission limit for the emission of SO2 from a cement manufacturing facility, for a year, is determined by using the formula
öÈ(EISO2i û Pi)/öÈPi
- where
- EISO2iô is the maximum emission-intensity for the emission of SO2 from the ith kiln in the cement manufacturing facility for the year, namely the maximum rate of emission of SO2 per tonne of clinker produced at the ith kiln in the cement manufacturing facility for the year, which is 3.0 kg/tonne;
- iô is the ith kiln in the cement manufacturing facility where i goes from 1 to n and where n is the number of kilns in the cement manufacturing facility; and
- Piô is the quantity of clinker, expressed in tonnes, produced by the ith kiln in the cement manufacturing facility for the year.
Quantity of NOx and SO2 ã CEMS
70. A responsible person for a cement manufacturing facility must determine the quantity, expressed in kilograms, of NOx and SO2 emitted from each kiln stack in the cement manufacturing facility during a year by using a continuous emission monitoring system and a device to determine the flow rate of emissions on a continuous basis.
Quantity of clinker
71. (1) For the purpose of determining the value for Pj in section 68 or 69, the responsible person for a cement manufacturing facility must determine the quantity of clinker produced at each kiln in the cement manufacturing facility for the year by
- (a) weighing of that quantity directly using the measuring devices used for inventory purposes, such as weigh hoppers or weigh-belt feeders; or
- (b) applying a feedstock-to-clinker conversion factor, specific to the kiln, to a direct measurement of the quantity of feedstock introduced into the kiln during that year, which accurately determines the quantity of clinker produced from a given quantity of feedstock introduced.
Accuracy feedstock-to-clinker conversion factor
(2) The responsible person must verify the accuracy of the feedstock-to-clinker conversion factor
- (a) at least once per year, but at least four months after a previous verification; and
- (b) as soon as feasible after a major change to the clinker production processes that could affect the accuracy of the factor.
Annual report
72. A responsible person for a cement manufacturing facility must, on or before the June 1 that follows the year for which an annual report is made, send an annual report to the Minister that contains the information set out in Schedule 7 in respect of that year.
PART 4
GENERAL
CONTINUOUS EMISSIONS MONITORING SYSTEMS
CEMS Reference Method
73. (1) A responsible person who uses a CEMS for the purpose of these Regulations must comply with the CEMS Reference Method, other than its section 1.0, with the following modifications:
- (a) Table 1 entitled ãDesign Specifications for Continuous Emission Monitoring Systemsã is to be read without reference to the expression ãappropriate regulatory authorityã;
- (b) the following sections are to be read without reference to the expression ãappropriate regulatory authorityã:
- (i) 3.4,
- (ii) 3.4.2,
- (iii) 3.4.3,
- (iv) 5.3.1, and
- (v) 6.3.2.7;
- (c) the expression ãan independent reference method, which may be either a manual or automated procedure, as specified by the appropriate regulatory authorityã is to be read as ãEPA Method 7E, ASTM D6522-11 or an alternative rule approved under subsection 74(5) of the Multi-sector Air Pollutants Regulationsã in section 5.3.4;
- (d) the expression ãintegrating manual or automated methods specified by the appropriate regulatory authorityã is to be read as ãEPA Method 7E, ASTM D6522-11 or an alternative rule approved under subsection 74(5) of the Multi-sector Air Pollutants Regulationsã in section 5.3.4.3;
- (e) section 6.0 is to be read without reference to the expression ãregulatory agencyã;
- (f) section 6.5.2 is to be read without reference to the expression ãand the appropriate agencyã;
- (g) the Glossary is to be read without reference to the following definitions:
- (i) ãappropriate regulatory authorityã,
- (ii) ãbackfillingã, and
- (iii) ãunits of the standardã;
- (h) the definition ãreference methodã in the Glossary is to be read as follows: ãmeans any applicable Environment Canada method, including a method referred to in the Multi-sector Air Pollutants Regulations or an alternative rule approved under subsection 74(5) of those Regulations, for the measurement of stack gas flow, contaminant concentration, or diluent concentrationã;
- (i) section A.1 of Appendix A is to be read without reference to the expression ãappropriate regulatory agencyã;
- (j) section B.2.1 of Appendix B is to be read without reference to the expression ãappropriate regulatory agencyã; and
- (k) Appendix B is to be read without reference to its section B.4 entitled ãMethod C: Energy Balance Methodã.
Annual audit
(2) For each year during which a responsible person uses a CEMS, the responsible person must ensure that an auditor
- (a) determines, based on their review in accordance with section 6.5.2 of the CEMS Reference Method, whether, in the auditorãs opinion, the responsible personãs use of the CEMS complied with the Quality Assurance/Quality Control manual referred to in section 6 of the CEMS Reference Method;
- (b) verifies that the Quality Assurance/Quality Control manual has been updated in accordance with section 6.5.2 of the CEMS Reference Method; and
- (c) evaluates whether, in the auditorãs opinion, the responsible person complied with the CEMS Reference Method and the CEMS met the specifications set out in the CEMS Reference Method, in particular, in its sections 3 to 5.
Auditorãs report
(3) The responsible person must, without delay following the audit, obtain a report, signed by the auditor, that contains the information set out in Schedule 8.
Auditor
(4) For the purpose of this section, an auditor is a person who
- (a) is independent of the responsible person who is to be audited; and
- (b) has demonstrated knowledge of and experience in
- (i) the certification, operation and relative accuracy test audit (RATA) of continuous emission monitoring systems, and
- (ii) quality assurance and quality control procedures in relation to those systems.
ALTERNATIVE RULES
CEMS and stack tests
74. (1) A rule incorporated by reference into these Regulations from the CEMS Reference Method, EPA Method 7E or ASTM D6522-11, or a provision in these Regulations related to the rule, may be replaced by an alternative rule that is provided for under provincial law with respect to
- (a) sampling, analyses, tests, measurements or monitoring of emissions; or
- (b) any condition, test procedure or laboratory practice that is relevant to those requirements.
Application
(2) A responsible person may, in writing, apply to the Minister for approval to comply with an alternative rule in respect of one of their boilers or heaters, engines or cement manufacturing facilities.
Information requirements
(3) The application must include information, with supporting documents, that demonstrates
- (a) that the responsible person must, under the provincial law, comply with the alternative rule in respect of the responsible personãs boiler or heater, engine or cement manufacturing facility; and
- (b) that the alternative rule is of similar rigour and effectiveness, for the purpose of these Regulations, as the rule it replaces.
Other information
(4) The application must also include the following information:
- (a) information that uniquely identifies the boiler or heater, the engine or replacement unit or the cement manufacturing facility, as the case may be, including
- (i) for boilers and heaters,
- (A) its serial number, and
- (B) the civic address of the facility where the boiler or heater is located and its unique identifier, if any, within that facility,
- (ii) for engines and replacement units,
- (A) its serial number, as specified on its nameplate provided by the manufacturer or, in the absence of such a nameplate, as set out in a document provided by the manufacturer, and
- (B) the civic address of the facility where it is located or, if there is no civic address, its latitude and longitude, and
- (iii) for cement manufacturing facilities,
- (A) its name and civic address, if any,
- (B) its latitude and longitude,
- (C) its National Pollutant Release Inventory identification number assigned by the Minister for the purpose of section 48 of the Act,
- (D) the number of kilns, and
- (E) for each kiln, its type; and
- (i) for boilers and heaters,
- (b) any other information that is necessary, under the circumstances, to consider the application.
Approval
(5) The Minister must grant the application and approve the alternative rule ã with any variation, or subject to any conditions, that the Minister considers desirable ã if the Minister is of the opinion that that alternative rule is of similar rigour and effectiveness, for the purpose of these Regulations, as the rule it replaces.
Publication
(6) Without delay after approving an alternative rule, the Minister must publish it on the Environmental Registry, along with a statement indicating that it has been approved as an alternative rule for the purpose of these Regulations and the rule that it is an alternative to.
Alternative rule applies to every responsible person
(7) The alternative rule as approved by the Minister applies to every responsible person in respect of the boiler or heater, engine or cement manufacturing facility that was the subject of the application.
Refusal
(8) The Minister must refuse the application if the Minister has reasonable grounds to believe that the applicant has, with their application, provided false or misleading information.
Revocation under law
(9) The alternative rule as approved by the Minister is revoked as of the day on which the responsible person no longer has to, under the provincial law, comply with the alternative rule referred to in paragraph (3)(a) in respect of the responsible personãs boiler or heater, engine or cement manufacturing facility.
Revocation by Minister
(10) The Minister must revoke the alternative rule as approved by the Minister if the Minister
- (a) no longer has the opinion that that alternative rule is of similar rigour and effectiveness, for the purpose of these Regulations as the rule it replaces; or
- (b) has reasonable grounds to believe that the responsible person had, with their application, provided false or misleading information to the Minister.
Removal from Environmental Registry
(11) Without delay after a revocation of an alternative rule, the Minister must remove it from the Environmental Registry.
REPORTING, SENDING, RECORDING AND RETENTION OF INFORMATION
Electronic
75. (1) A report, notice or information that is required to be sent, or an application that is made, under these Regulations must be sent electronically in the form and format specified by the Minister and must bear the electronic signature of an authorized official of the responsible person.
Paper
(2) If the Minister has not specified an electronic form and format or if it is impractical to send the report, notice, information or application electronically in accordance with subsection (1) because of circumstances beyond the personãs control, the report or notice, information or application must be sent on paper, signed by an authorized official of the responsible person, and in the form and format specified by the Minister. However, if no form and format have been so specified, it may be in any form and format.
Records
76. (1) A responsible person for a boiler or heater, engine or cement manufacturing facility must make a record
- (a) of every document or information that supports the validity of any information sent to the Minister under these Regulations;
- (b) of every measurement and calculation, along with supporting documents, used to determine a value of an element of a formula set out in these Regulations, as well as any information used to determine or fix one of those values;
- (c) if the responsible person uses a CEMS under these Regulations,
- (i) of every document or information referred to in the CEMS Reference Method, or in an alternative rule, that the responsible person is required to make or obtain under that method or rule,
- (ii) of every measure of a concentration and of flow used for every calculation, along with supporting documents, necessary to determine an emission-intensity;
- (d) that consists of documentation demonstrating that the installation, maintenance and calibration of measuring devices was done in accordance with these Regulations; and
- (e) of any other information relevant to the responsible personãs compliance with these Regulations in respect of the boiler or heater, engine or cement manufacturing facility.
When records made
(2) Records required to be made by a responsible person under these Regulations must be made as soon as feasible but not later than 30 days after the the day on which information to be recorded becomes available.
Five-year retention
(3) A responsible person who is required, under these Regulations, to make a record or to send a report, notice or information or who makes an application under these Regulations must keep the record or a copy of the report, notice, information or application, as well as any supporting documents, for at least five years after they make or send it.
No retention if online
(4) Despite subsection (3), any information that otherwise must be kept in a copy referred to in that subsection that has been sent by a responsible person for inclusion in the engine registry, or another online electronic reporting site established by the Minister, does not need to be kept if the Minister has provided the responsible person with an acknowledgment of receipt of that information.
Record location
(5) The record or copy must be kept at the responsible personãs principal place of business in Canada or at any other place in Canada where it can be inspected. If the record or copy is kept at any of those other places, the person must provide the Minister with the civic address of that other place.
Change of address
(6) If the civic address changes, the responsible person must notify the Minister in writing within 30 days after the change.
Corrections
77. A responsible person who has sent information to the Minister under these Regulations must, without delay, inform the Minister of any errors contained in that information and provide the Minister with the corrected information.
COMING INTO FORCE
January 1, 2015
78. (1) These Regulations, except section 67, come into force on January 1, 2015.
January 1, 2017
(2) Section 67 comes into force on January 1, 2017.
SCHEDULE 1
(Subsection 12(1))
LOSS OF THERMAL EFFICIENCY ã WATERTUBE BOILERS
| Rated Capacity GJ | 100% | 80% | 60% |
|---|---|---|---|
| 10.5 | 1.60 | 2.00 | 2.67 |
| 21.1 | 1.05 | 1.31 | 1.75 |
| 31.6 | 0.84 | 1.05 | 1.40 |
| 42.2 | 0.73 | 0.91 | 1.22 |
| 52.8 | 0.66 | 0.82 | 1.10 |
| 63.3 | 0.62 | 0.78 | 1.03 |
| 73.9 | 0.59 | 0.74 | 0.98 |
| 84.4 | 0.56 | 0.70 | 0.93 |
| 95.0 | 0.54 | 0.68 | 0.90 |
| 105.5 | 0.52 | 0.65 | 0.87 |
| 126.5 | 0.48 | 0.60 | 0.80 |
| 147.7 | 0.45 | 0.56 | 0.75 |
| 168.8 | 0.43 | 0.54 | 0.72 |
| 189.9 | 0.40 | 0.50 | 0.67 |
| 211.0 | 0.38 | 0.48 | 0.64 |
| 422.0 | 0.30 | 0.38 | 0.50 |
| 633.0 | 0.27 | 0.34 | 0.45 |
| 844.0 | 0.25 | 0.31 | 0.42 |
| 1055 | 0.23 | 0.29 | 0.38 |
| 2110 | 0.20 | 0.25 | 0.33 |
SCHEDULE 2
(Subsection 12(3))
DEFAULT HIGHER HEATING VALUES
TABLE 1
| Item | Column 1 Type of fuel |
Column 2 Default higher heating value (GJ/tonne) |
|---|---|---|
| 1. | Bituminous Canadian coal ã Western | 25.6 |
| 2. | Bituminous Canadian coal ã Eastern | 27.9 |
| 3. | Bituminous non-Canadian coal ã U.S. | 25.7 |
| 4. | Bituminous non-Canadian coal ã Other Countries | 29.9 |
| 5. | Sub-bituminous Canadian coal ã Western | 19.2 |
| 6. | Sub-bituminous non-Canadian coal ã U.S. | 19.2 |
| 7. | Coal ã lignite | 15.0 |
| 8. | Coal ã anthracite | 27.7 |
| 9. | Coal coke and metallurgical coke | 28.8 |
| 10. | Petroleum coke from refineries | 46.4 |
| 11. | Petroleum coke from upgraders | 40.6 |
| 12. | Municipal solid waste | 11.5 |
| 13. | Tires | 31.2 |
| 14. | Wood and wood waste (See Note 1) | 19.0 |
| 15. | Agricultural byproducts (See Note 2) | 17.0 |
| 16. | Peat (See Note 3) | 9.3 |
- Note 1
The default higher heating values for wood and wood waste, agricultural byproducts and peat are on a totally dry basis. The default higher heating values for the other types of fuel are on a wet basis. - Note 2
The default higher heating values for wood and wood waste, agricultural byproducts and peat are on a totally dry basis. The default higher heating values for the other types of fuel are on a wet basis. - Note 3
The default higher heating values for wood and wood waste, agricultural byproducts and peat are on a totally dry basis. The default higher heating values for the other types of fuel are on a wet basis.
TABLE 2
| Item | Column 1 Type of fuel |
Column 2 Default higher heating value (GJ/kL) |
|---|---|---|
| 1. | Diesel | 38.3 |
| 2. | Light fuel oil | 38.8 |
| 3. | Heavy fuel oil | 42.5 |
| 4. | Ethanol | 21.0 |
| 5. | Distillate fuel oil No. 1 | 38.78 |
| 6. | Distillate fuel oil No. 2 | 38.50 |
| 7. | Distillate fuel oil No. 4 | 40.73 |
| 8. | Kerosene | 37.68 |
| 9. | Liquefied petroleum gases (LPG) | 25.66 |
| 10. | Natural gasoline | 30.69 |
| 11. | Motor gasoline | 34.87 |
| 12. | Aviation gasoline | 33.52 |
| 13. | Kerosene-type aviation | 37.66 |
TABLE 3
| Item | Column 1 Type of fuel |
Column 2 Default higher heating value (GJ/standard m3) |
|---|---|---|
| 1. | Biogas (captured methane) | 0.0281 |
| 2. | Propane (pure, not mixtures of LPG) (See Note 4) | 25.31 |
| 3. | Propylene | 25.39 |
| 4. | Ethane | 17.22 |
| 5. | Ethylene | 27.90 |
| 6. | Isobutane | 27.06 |
| 7. | Isobutylene | 28.73 |
| 8. | Butane | 28.44 |
| 9. | Butylene | 28.73 |
Note 4
The default higher heating value and the default CO2 emission factor for propane are only for pure gas propane. The product commercially sold as propane is to be considered LPG for the purpose of these Regulations.
SCHEDULE 3
(Subsection 26(5) and section 30)
CHANGE REPORT OR ANNUAL REPORT ã INFORMATION REQUIRED
1. The following information respecting the responsible person:
- (a) an indication of whether they are an owner or operator of the boiler or heater and their name and civic address;
- (b) the name, title, civic and postal addresses, telephone number and, if any, email address and fax number, of their authorized official; and
- (c) the name, title, civic and postal addresses, telephone number and, if any, email address and fax number, of a contact person, if different from the authorized official.
2. The following information respecting the boiler or heater:
- (a) its serial number;
- (b) the civic address of the facility where it is located; and
- (c) its unique identifier, if any, within the facility.
3. The following information ã if it has changed since the most recent initial report or annual report ã respecting the boiler or heater:
- (a) for each responsible person for the boiler or heater, other than the responsible person mentioned in paragraph 1(a), if any
- (i) their name and civic address, and
- (ii) an indication of whether they are an owner or operator;
- (b) an indication of whether it is a boiler or a heater;
- (c) its rated capacity;
- (d) for a class 80 original boiler or heater or a class 70 original boiler or heater or a modern or transitional boiler or heater, the serial number of each of its burners;
- (e) for a class 80 original boiler or heater or a class 70 original boiler or heater, the floor plan for the facility where it is located;
- (f) for a modern or transitional boiler or heater, its commissioning date;
- (g) for a modern boiler, its thermal efficiency determined in accordance with section 12 of these Regulations;
- (h) for a modern heater, the rated capacity of any equipment used to preheat the air; and
- (i) for a class 80 original boiler or heater or a class 70 original boiler or heater that has undergone a major modification,
- (i) the commissioning date for the boiler or heater with that major modification, and
- (ii) a description of the major modification.
4. The following information respecting tests on the boiler or heater:
- (a) for a boiler or heater on which a stack test was conducted,
- (i) the date on which the stack test was conducted,
- (ii) the percentage of its rated capacity at which the boiler or heater was operating during the stack test,
- (iii) a confirmation that the stack test was conducted while the boiler or heater was operating at a steady-state and a description of that steady-state,
- (iv) for modern boilers or heaters, the methane content of the gaseous fossil fuel combusted during the stack test,
- (v) the percentage of the boilerãs or heaterãs input energy in its combustion chamber coming from gaseous fossil fuel during the stack test,
- (vi) the method referred to in subsection 15(2) of these Regulations used for the stack test to measure the concentration of NOx and if an alternative rule approved under subsection 74(5) of these Regulations was used, that rule and the rule it replaced, and
- (vii) the emission-intensity of the boiler or heater, as determined in accordance with section 16 of these Regulations, for each of the three test-runs that comprises the stack test and the average of those emission-intensities; and
- (b) for a boiler or heater for which a CEMS was used to conduct the test,
- (i) whether an alternative rule approved under subsection 74(5) of these Regulations was used and, if so, that rule and the rule it replaced,
- (ii) the number of hours in the reference period,
- (iii) the lowest percentage of the boiler or heaterãs input energy in its combustion chamber coming from gaseous fossil fuel during the period ã referred to in subsection 18(1) or (2) of these Regulations, as the case may be ã during which the greatest rolling hourly average emission-intensity among all the rolling hourly averages in the reference period was recorded by the CEMS,
- (iv) for modern boilers or heaters, the average of the methane content of the gaseous fossil fuel combusted during the period ã referred to in subsection 18(1) or (2) of these Regulations, as the case may be ã during which the greatest rolling hourly average emission-intensity among all the rolling hourly averages in the reference period was recorded by the CEMS,
- (v) the result of the CEMS test, namely the greatest rolling hourly average among the rolling hourly averages in the reference period that constitutes the emission-intensity of the boiler or heater, as determined in accordance with, as applicable, any of sections 19 to 26 of these Regulations, and
- (vi) the date and time of that greatest rolling hourly average.
SCHEDULE 4
(Section 29)
INITIAL REPORT ã INFORMATION REQUIRED
1. The following information respecting the responsible person:
- (a) an indication of whether they are an owner or operator of the boiler or heater and their name and civic address;
- (b) the name, title, civic and postal addresses, telephone number and, if any, email address and fax number, of their authorized official; and
- (c) the name, title, civic and postal addresses, telephone number and, if any, email address and fax number, of a contact person, if different from the authorized official.
2. The following information respecting the boiler or heater:
- (a) for each responsible person for the boiler or heater, other than the responsible person mentioned in paragraph 1(a), if any
- (i) their name and civic address, and
- (ii) an indication of whether they are an owner or operator;
- (b) an indication of whether it is a boiler or a heater;
- (c) its serial number;
- (d) its rated capacity;
- (e) the civic address of the facility where it is located;
- (f) its unique identifier, if any, within the facility;
- (g) for a class 80 original boiler or heater or a class 70 original boiler or heater, the serial number of each of its burners;
- (h) for a class 80 original boiler or heater or a class 70 original boiler or heater, the floor plan for the facility where it is located;
- (i) for a modern or transitional boiler or heater, its commissioning date;
- (j) for modern boilers or heaters that have a rated capacity of greater than 262.5 GJ/hr, a copy of the documents that establish that the boiler or heater is designed to have, for any conditions under which it operates, a maximum emission-intensity of
- (i) 13 g/GJ, for a modern boiler, and
- (ii) 16 g/GJ, for a modern heater;
- (k) for a modern boiler, its thermal efficiency, as determined in accordance with section 12 of these Regulations;
- (l) for a modern heater, the rated capacity of any equipment used to preheat the air;
- (m) for a boiler or heater on which an initial stack test was conducted,
- (i) the date on which the initial stack test was conducted,
- (ii) the percentage of its rated capacity at which the boiler or heater was operating during the initial stack test,
- (iii) a confirmation that the initial stack test was conducted while the boiler or heater was operating at a steady-state and a description of that steady-state,
- (iv) for modern boilers or heaters, the methane content of the gaseous fossil fuel combusted during the initial stack test,
- (v) the percentage of the boilerãs or heaterãs input energy in its combustion chamber coming from gaseous fossil fuel during the initial stack test,
- (vi) the method referred to in subsection 15(2) of these Regulations used for the initial stack test to measure the concentration of NOx and if an alternative rule approved under subsection 74(5) of these Regulations was used, that rule and the rule it replaced, and
- (vii) the emission-intensity of the boiler or heater determined in accordance with section 16 of these Regulations for each of the three test-runs that comprises the initial stack test and the average of those emission-intensities; and
- (n) for a boiler or heater for which a CEMS was used for the initial test,
- (i) whether an alternative rule approved under subsection 74(5) of these Regulations was used and, if so, that rule and the rule it replaced,
- (ii) the number of hours in the reference period,
- (iii) the lowest percentage of the boiler or heaterãs input energy in its combustion chamber coming from gaseous fossil fuel during the period ã referred to in subsection 18(1) or (2) of these Regulations, as the case may be ã during which the greatest rolling hourly average emission-intensity among all the rolling hourly averages in the reference period was recorded by the CEMS,
- (iv) for modern boilers or heaters, the average of the methane content of the gaseous fossil fuel combusted during the period ã referred to in subsection 18(1) or (2) of these Regulations, as the case may be ã during which the greatest rolling hourly average emission-intensity among all the rolling hourly averages in the reference period was recorded by the CEMS,
- (v) the result of the initial CEMS test, namely the greatest rolling hourly average among the rolling hourly averages in the reference period that constitutes the emission-intensity of the boiler or heater, as determined in accordance with, as applicable, any of sections 19 to 26 of these Regulations, and
- (vi) the date and time of that greatest rolling hourly average.
SCHEDULE 5
(Subsections 45(1) and 60(3))
ENGINE REGISTRY ã INFORMATION REQUIRED
1. The following information respecting the responsible person:
- (a) their name, civic and postal addresses, telephone number and, if any, email address and fax number;
- (b) an indication of whether they are an owner or operator of the engine;
- (c) the name, title, civic and postal addresses, telephone number and, if any, email address and fax number, of their authorized official;
- (d) the name, title, civic and postal addresses, telephone number and, if any, email address and fax number, of a contact person, if different from the authorized official;
- (e) an indication as to whether they made an election referred to in subsection 42(2) of these Regulations and the date on which they made the election, if applicable; and
- (f) if applicable, the date on which a notification referred to in subsection 42(7) of these Regulations was sent.
2. The following information respecting the engine or the replacement unit, as the case may be:
- (a) for each responsible person for the engine or replacement unit, other than the responsible person mentioned in paragraph 1(a), if any
- (i) their name and civic address, and
- (ii) an indication of whether they are an owner or operator;
- (b) the civic address of the facility where the engine or replacement unit is located or, if there is no civic address, its latitude and longitude;
- (c) its serial number, as specified on its nameplate provided by its manufacturer or, in the absence of that nameplate, as set out in a document provided by its manufacturer;
- (d) its make and model;
- (e) in the case of an engine, whether it is an original engine or a modern engine;
- (f) its rated brake power, expressed in kW;
- (g) in the case of an engine, whether it is a
- (i) two-stroke lean-burn engine,
- (ii) four-stroke lean-burn engine, or
- (iii) four-stroke rich-burn engine;
- (h) the type of emission control system, if any, with which it is equipped;
- (i) in the case of a modern engine, the date on which it began to operate;
- (j) in the case of an original engine
- (i) the date on which it was designated as belonging to the responsible personãs group,
- (ii) if applicable, the date on which that designation was cancelled, and
- (iii) if the engine is a four-stroke lean-burn engine, the excess oxygen content in the exhaust gas;
- (k) in the case of a replacement unit or modern replacement engine,
- (i) the date on which the replacement occurred,
- (ii) the serial number of each of the original engines that were replaced, and
- (iii) the date on which each of those original engines were removed from the responsible personãs group;
- (l) in the case of a replacement unit, whether it is
- (i) an electric motor, or
- (ii) a turbine;
- (m) if applicable, the serial number of the
- (i) engines and replacement units that belong to the same subgroup as the engine or replacement unit in question, and
- (ii) the engines that belong to the subset described in subsection 41(1) of these Regulations; and
- (n) for an engine or replacement unit that belongs to a subgroup, the emission-value assigned to it.
SCHEDULE 6
(Section 63)
ANNUAL REPORT ã INFORMATION REQUIRED
1. The name, civic and postal addresses, telephone number and, if any, email address and fax number, of the responsible person who is sending the annual report.
2. The following information respecting each performance test referred to in section 53 of these Regulations conducted by the responsible person during the year in question:
- (a) the date on which the test was conducted and the name of the person and, if different. of the individual, who conducted the performance test;
- (b) the serial number of the engine tested, as specified on the nameplate provided by its manufacturer or, in the absence of such a nameplate, as set out in a document provided by its manufacturer or by a government body;
- (c) the methods referred to in subsections 50(1), (2) and (4) of these Regulations that were used to conduct the test; and
- (d) the emission-intensity of the engine, as determined under section 53 of these Regulations.
3. The following information respecting each low-use engine of the responsible person:
- (a) the serial number of the engine, as specified on the nameplate provided by its manufacturer or, in the absence of such a nameplate, as set out in a document provided by its manufacturer or by a government body;
- (b) the number of hours during which it operated during the year in question as measured on a continuous basis by means of a non-resettable hour meter or another non-resettable device; and
- (c) if applicable, the number of hours, expressed in whole hours, during which the engine operated during an emergency during the year in question.
4. For each of the responsible personãs subgroups, if they made an election referred to in subsection 42(1) of these Regulations that remains in effect,
- (a) the serial number of the engines and replacement units that belonged to the subgroup during the year in question;
- (b) for each of those engines and replacement units, each emission-value assigned to it during the year in question;
- (c) for each of those engines and replacement units and for each emission-value assigned to it during the year in question, the number of hours during that year during which it operated while belonging to that subgroup and having that assigned emission-value;
- (d) for each of those engines and replacement units, the total number of hours contained in all periods referred to in section 35 of these Regulations during the year in question; and
- (e) the yearly average emission-intensity of the subgroup, as determined in accordance with subsection 42(4) of these Regulations, expressed in ppmvd or g/kWh.
5. If applicable, the following information respecting the subset described to in section 41 of these Regulations:
- (a) for each engine belonging to the subset and each engine referred to in subsection 41(2) of these Regulations, its serial number, as specified on the nameplate provided by its manufacturer or, in the absence of such a nameplate, as set out in a document provided by its manufacturer or by a government body; and
- (b) information that demonstrates that the total rated brake power of the subset is at least 50% of the total rated brake power of the responsible personãs group.
6. For each engine referred to in section 54 of these Regulations, the following information respecting each determination referred to in that section of the percentage of oxygen in the engineãs exhaust gas made by the responsible person during the year in question:
- (a) the date of the determination;
- (b) the serial number of the engine, as specified on its nameplate provided by its manufacturer or, in the absence of that nameplate, as set out in a document provided by the engineãs manufacturer or by a government body; and
- (c) the percentage of oxygen.
SCHEDULE 7
(Section 72)
ANNUAL REPORT ã INFORMATION REQUIRED
1. The following information respecting the responsible person:
- (a) an indication of whether they are an owner or operator of the cement manufacturing facility and their name and civic address;
- (b) the name, title, civic and postal addresses, telephone number and, if any, email address and fax number, of their authorized official; and
- (c) the name, title, civic and postal addresses, telephone number and, if any, email address and fax number, of a contact person, if different from the authorized official.
2. The following information respecting the cement manufacturing facility:
- (a) for each responsible person for the cement manufacturing facility, other than the responsible person mentioned in paragraph 1(a), if any
- (i) their name and civic address, and
- (ii) an indication of whether they are an owner or operator;
- (b) its name and civic address, if any;
- (c) its latitude and longitude;
- (d) its National Pollutant Release Inventory identification number assigned by the Minister for the purpose of section 48 of the Act;
- (e) the number of kilns;
- (f) for each kiln, its type; and
- (g) for each kiln, for the year for which the annual report is made,
- (i) the quantity of NOx emitted, expressed in kilograms,
- (ii) the quantity of SO2 emitted, expressed in kilograms, and
- (iii) the quantity of clinker produced, expressed in tonnes.
3. If applicable, the emission-intensity elected by the responsible person in accordance with subsection 68(2) of these Regulations as the value for EINOxi in subsection 68(1) of these Regulations.
SCHEDULE 8
(Subsection 73(3))
AUDITORãS REPORT ã INFORMATION REQUIRED
1. The name, civic address and telephone number of the responsible person.
2. The name, civic address, telephone number and qualifications of the auditor and, if any, their fax number and email address.
3. The procedures followed by the auditor to assess whether
- (a) the responsible personãs use of the CEMS complied with the Quality Assurance/Quality Control manual referred to in section 6 of the CEMS Reference Method;
- (b) the responsible person complied with the CEMS Reference Method; and
- (c) the CEMS has met the specifications set out in the CEMS Reference Method, in particular, in its sections 3 to 5.
4. A declaration of the auditorãs opinion as to whether
- (a) the responsible personãs use of the CEMS complied with the Quality Assurance/Quality Control manual referred to in section 6 of the CEMS Reference Method;
- (b) the responsible person complied with the CEMS Reference Method; and
- (c) the CEMS has met the specifications set out in the CEMS Reference Method, in particular, in its sections 3 to 5.
5. A declaration of the auditorãs opinion as to whether the responsible person has ensured that the Quality Assurance/Quality Control manual was updated in accordance with section 6.5.2 of the CEMS Reference Method.
[23-1-o]